2015 Epping Forest District Council election
The 2015 Epping Forest District Council election took place on 7 May 2015 to elect members of Epping Forest District Council in England. This was on the same day as other local elections.
| |||||||||||||||||||||||||||||||||||||||||||||||||||||||||||||||||||||||
18 of 58 seats on Epping Forest District Council 30 seats needed for a majority | |||||||||||||||||||||||||||||||||||||||||||||||||||||||||||||||||||||||
|---|---|---|---|---|---|---|---|---|---|---|---|---|---|---|---|---|---|---|---|---|---|---|---|---|---|---|---|---|---|---|---|---|---|---|---|---|---|---|---|---|---|---|---|---|---|---|---|---|---|---|---|---|---|---|---|---|---|---|---|---|---|---|---|---|---|---|---|---|---|---|---|
| Turnout | 62.4% ( | ||||||||||||||||||||||||||||||||||||||||||||||||||||||||||||||||||||||
| |||||||||||||||||||||||||||||||||||||||||||||||||||||||||||||||||||||||
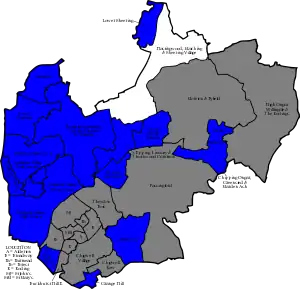 Results of the 2015 District Council elections | |||||||||||||||||||||||||||||||||||||||||||||||||||||||||||||||||||||||
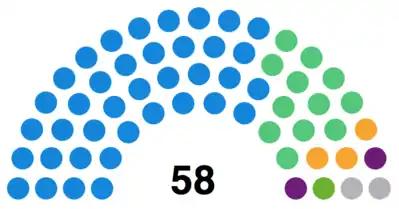 Council composition following the election | |||||||||||||||||||||||||||||||||||||||||||||||||||||||||||||||||||||||
| |||||||||||||||||||||||||||||||||||||||||||||||||||||||||||||||||||||||
This election marks the last time a Labour councillor sat in the chamber after Peter Gode of Shelley stood down - a dramatic decline following Labour being the largest party in the mid-1990s.
By-elections
Epping Hemnall By-election
A by-election was held on 25 September 2014 following the death of Mayor Ken Avey. Liberal Democrat, Kim Adams won with 43% of the vote compared to 28% for the Conservative party and 24% to UKIP. This election reversed this by-election result with Avey's son, Nigel replacing him, ousting the Liberal Democrat councillor
| Party | Candidate | Votes | % | ±% | |
|---|---|---|---|---|---|
| Liberal Democrats | Kim Adams | 607 | 43.3 | ||
| Conservative | Nigel Avey | 386 | 27.5 | ||
| UKIP | Andrew Smith | 339 | 24.1 | ||
| Green | Anna Widdup | 69 | 4.9 | ||
| Majority | 221 | 15.8 | N/A | ||
| Turnout | 1,401 | 29.0 | |||
| Liberal Democrats gain from Conservative | Swing | ||||
Broadley Common, Epping Forest & Nazeing By-election
| Party | Candidate | Votes | % | ±% | |
|---|---|---|---|---|---|
| Conservative | Robert Glozier | 155 | 50.4 | ||
| UKIP | Ron McEvoy | 122 | 39.7 | N/A | |
| Green | William Hartington | 23 | 7.4 | ||
| Liberal Democrats | Arnold Verrall | 7 | 2.2 | ||
| Majority | 33 | 10.7 | |||
| Turnout | 307 | 18% | |||
| Conservative hold | Swing | ||||
Ward Results
Figures are compared to the last time these seats were contested in any election cycle for the Epping Forest District Council election, this is indicated.
Broadley Common, Epping Forest & Nazeing
| Party | Candidate | Votes | % | ±% | |
|---|---|---|---|---|---|
| Conservative | Lynn Hughes | 761 | 65.8 | ||
| UKIP | Kevin Byford | 256 | 22.1 | N/A | |
| Green | Timothy Widdup | 77 | 6.6 | ||
| Liberal Democrats | Enid Robinson | 62 | 5.3 | ||
| Majority | 505 | 43.7 | |||
| Turnout | 1,156 | 67% | |||
| Conservative hold | Swing | ||||
Buckhurst Hill West
| Party | Candidate | Votes | % | ±% | |
|---|---|---|---|---|---|
| Conservative | Aniket Patel | 2,450 | 63.3 | ||
| Liberal Democrats | Chris Greaves | 604 | 15.6 | ||
| Labour | Angela Ayre | 455 | 11.8 | ||
| Green | Roger Neville | 363 | 9.4 | ||
| Majority | 1,846 | 47.7 | |||
| Turnout | 3,872 | 72% | |||
| Conservative hold | Swing | ||||
Chipping Ongar, Greensted & Marden Ash
| Party | Candidate | Votes | % | ±% | |
|---|---|---|---|---|---|
| Conservative | Paul Keska | 1,268 | 51.6 | ||
| UKIP | Llyris Stebbings | 553 | 22.5 | ||
| Liberal Democrats | Barbara Szymanek | 428 | 17.4 | ||
| Green | Stephen Delarre | 207 | 8.4 | ||
| Majority | 715 | 29.1 | |||
| Turnout | 2,456 | 72% | |||
| Conservative hold | Swing | ||||
Epping Hemnall
| Party | Candidate | Votes | % | ±% | |
|---|---|---|---|---|---|
| Conservative | Nigel Avey | 1,368 | 39.0 | ||
| Liberal Democrats | Kim Adams | 1,131 | 32.2 | ||
| UKIP | Barry Johns | 532 | 15.1 | ||
| Labour | Inez Collier | 302 | 8.6 | ||
| Green | Anna Widdup | 173 | 4.9 | ||
| Majority | 237 | 6.8 | |||
| Turnout | 3,506 | 71% | |||
| Conservative gain from Liberal Democrats | Swing | ||||
Epping Lindsey & Thornwood Common
| Party | Candidate | Votes | % | ±% | |
|---|---|---|---|---|---|
| Conservative | Chris Whitbread | 2,182 | 61.7 | ||
| Liberal Democrats | Ingrid Black | 558 | 15.7 | ||
| Labour | Simon Bullough | 524 | 14.8 | ||
| Green | William Hartington | 272 | 7.7 | ||
| Majority | 1,624 | 46.0 | |||
| Turnout | 3,536 | 69% | |||
| Conservative hold | Swing | ||||
Grange Hill
| Party | Candidate | Votes | % | ±% | |
|---|---|---|---|---|---|
| Conservative | Kewal Chana | 1,802 | 55.3 | ||
| Labour | Isuru Perera | 678 | 20.8 | N/A | |
| UKIP | Simon Hearn | 584 | 17.9 | N/A | |
| Liberal Democrats | Pesh Kapasiawala | 194 | 5.9 | ||
| Majority | 1,124 | 34.5 | |||
| Turnout | 3,258 | 63% | |||
| Conservative hold | Swing | ||||
Hastingwood, Matching & Sheering Village
| Party | Candidate | Votes | % | ±% | |
|---|---|---|---|---|---|
| Independent | Richard Morgan | 648 | 46.1 | ||
| Conservative | Joanne Share-Bernia | 597 | 42.5 | N/A | |
| Labour | Sandra Jenner | 160 | 11.3 | N/A | |
| Majority | 51 | 3.6 | |||
| Turnout | 1,405 | 74% | |||
| Independent hold | Swing | ||||
Lambourne
| Party | Candidate | Votes | % | ±% | |
|---|---|---|---|---|---|
| Conservative | Brian Rolfe | 706 | 69.6 | ||
| UKIP | David Mills | 308 | 30.3 | N/A | |
| Majority | 398 | 39.3 | |||
| Turnout | 1,014 | 68% | |||
| Conservative hold | Swing | ||||
Lower Nazeing
| Party | Candidate | Votes | % | ±% | |
|---|---|---|---|---|---|
| Conservative | Richard Bassett | 1,775 | 81.5 | ||
| Labour | Kelvin Morris | 401 | 18.4 | ||
| Majority | 1,374 | 63.1 | |||
| Turnout | 2,176 | 67% | |||
| Conservative hold | Swing | ||||
Lower Sheering
| Party | Candidate | Votes | % | ±% | |
|---|---|---|---|---|---|
| Conservative | Gary Waller | 821 | 69.8 | ||
| Labour | Laurence Morter | 354 | 30.1 | N/A | |
| Majority | 467 | 39.7 | |||
| Turnout | 1,175 | 69% | |||
| Conservative hold | Swing | ||||
North Weald Bassett
| Party | Candidate | Votes | % | ±% | |
|---|---|---|---|---|---|
| Conservative | Anne Grigg | 1,452 | 59.8 | ||
| UKIP | Paul Stevens | 620 | 25.5 | ||
| Liberal Democrats | Arnold Verrall | 180 | 7.4 | ||
| Green | Nicole Barnecutt | 176 | 7.2 | N/A | |
| Majority | 832 | 34.3 | |||
| Turnout | 2,428 | 66% | |||
| Conservative hold | Swing | ||||
Roydon
| Party | Candidate | Votes | % | ±% | |
|---|---|---|---|---|---|
| Conservative | Mary Sartin | 1,060 | 83.3 | ||
| Labour | Janice Croke | 211 | 16.6 | ||
| Majority | 849 | 66.7 | |||
| Turnout | 1,271 | 70% | |||
| Conservative hold | Swing | ||||
Shelley
| Party | Candidate | Votes | % | ±% | |
|---|---|---|---|---|---|
| Conservative | Nigel Bedford | 467 | 48.3 | ||
| UKIP | Isobel Gould | 278 | 28.8 | N/A | |
| Labour | Robert Greyson | 220 | 22.7 | ||
| Majority | 189 | 20.3 | |||
| Turnout | 965 | 55% | |||
| Conservative gain from Labour | Swing | ||||
Waltham Abbey High Beach
| Party | Candidate | Votes | % | ±% | |
|---|---|---|---|---|---|
| Conservative | Sydney-Anne Stavrou | 839 | 67.6 | ||
| Independent | Paul Morris | 402 | 32.3 | N/A | |
| Majority | 437 | 35.3 | |||
| Turnout | 1,241 | 64% | |||
| Conservative hold | Swing | ||||
Waltham Abbey Honey Lane
| Party | Candidate | Votes | % | ±% | |
|---|---|---|---|---|---|
| Conservative | Simon Kane | 2,002 | 77.8 | ||
| Liberal Democrats | Bhupendra Patel | 569 | 22.1 | ||
| Majority | 1,433 | 55.7 | |||
| Turnout | 2,571 | 58% | |||
| Conservative hold | Swing | ||||
Waltham Abbey North East
| Party | Candidate | Votes | % | ±% | |
|---|---|---|---|---|---|
| Conservative | Ann Mitchell | 1,427 | 100% | ||
| Majority | 1,427 | 100% | N/A | ||
| Turnout | 1,427 | 61% | |||
| Conservative hold | Swing | ||||
Waltham Abbey Paternoster
| Party | Candidate | Votes | % | ±% | |
|---|---|---|---|---|---|
| Conservative | Elizabeth Ann Webster | N/A | 100% | ||
| Majority | N/A | 100% | |||
| Turnout | N/A | N/A | N/A | ||
| Conservative hold | Swing | ||||
Waltham Abbey South West
| Party | Candidate | Votes | % | ±% | |
|---|---|---|---|---|---|
| Conservative | Ricki Gadsby | 837 | 46.0 | ||
| UKIP | Ron McEnvoy | 574 | 31.5 | N/A | |
| Green | Dave Plummer | 243 | 13.3 | N/A | |
| Liberal Democrats | Phil Chadburn | 164 | 9.0 | ||
| Majority | 263 | 14.5 | |||
| Turnout | 1,818 | 58% | |||
| Conservative hold | Swing | ||||
References
- "Election results by party, 7 May 2015". www.eppingforestdc.gov.uk. 7 May 2015.