2015 Wigan Metropolitan Borough Council election
The 2015 Wigan Metropolitan Borough Council election took place on 7 May 2015 to elect members of Wigan Metropolitan Borough Council in England.[1] This was on the same day as other local elections and the general election.
 | |||||||||||||||||||||||||
25 of 75 seats to Wigan Metropolitan Borough Council 38 seats needed for a majority | |||||||||||||||||||||||||
|---|---|---|---|---|---|---|---|---|---|---|---|---|---|---|---|---|---|---|---|---|---|---|---|---|---|
| |||||||||||||||||||||||||
 | |||||||||||||||||||||||||
Overview
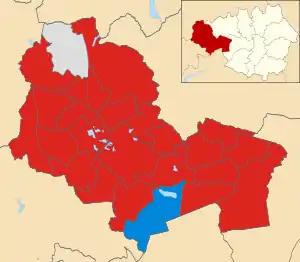
Prior to the election, the composition of the council was:
- Labour Party: 63
- Conservative Party: 2
- Independent: 10
After the election, the composition of the council was:
- Labour Party: 64
- Conservative Party: 3
- Independent: 8
| Party | Number |
|---|---|
| Labour Party (UK) | 25 |
| Conservative Party (UK) | 25 |
| UK Independence Party | 24 |
| Green Party of England and Wales | 9 |
| Independent | 8 |
| Left Unity | 8 |
| Community Action Party | 3 |
| Liberal Democrats (UK) | 2 |
| TUSC | 1 |
Results Summary
| 2015 Wigan Metropolitan Borough Council election | ||||||||||
|---|---|---|---|---|---|---|---|---|---|---|
| Party | This election | Full council | This election | |||||||
| Seats | Net | Seats % | Other | Total | Total % | Votes | Votes % | +/− | ||
| Labour | 23 | 92 | 41 | 64 | 85.3 | 71,184 | 50.4 | |||
| Conservative | 1 | 4 | 2 | 3 | 4 | 27,263 | 19.3 | |||
| Independent | 1 | 4 | 7 | 8 | 10.7 | 7,483 | 5.3 | |||
| UKIP | 0 | 0 | 0 | 0 | 0 | 29,622 | 21.0 | |||
| Green | 0 | 0 | 0 | 0 | 0 | 2,837 | 2.0 | New | ||
| Community Action | 0 | 0 | 0 | 0 | 0 | 1,115 | 0.8 | |||
| Left Unity | 0 | 0 | 0 | 0 | 0 | 990 | 0.7 | New | ||
| Liberal Democrats | 0 | 0 | 0 | 0 | 0 | 648 | 0.5 | |||
| TUSC | 0 | 0 | 0 | 0 | 0 | 99 | 0.1 | |||
Results
Atherton ward
| Party | Candidate | Votes | % | ±% | |
|---|---|---|---|---|---|
| Labour | Martin Luke Aldred | 2,508 | 39.9 | ||
| Independent | Norman Alec Bradbury | 1,989 | 31.7 | ||
| UKIP | Quinton John Smith | 950 | 15.1 | ||
| Conservative | Toby Joseph Hewitt | 788 | 12.5 | ||
| Left Unity | Craig Anthony Wilson | 46 | 0.7 | ||
| Majority | 519 | 8.2 | |||
| Turnout | 6,281 | ||||
| Labour gain from Independent | Swing | ||||
Astley Mosley Common ward
| Party | Candidate | Votes | % | ±% | |
|---|---|---|---|---|---|
| Labour | Christine Lilian Roberts | 2,478 | 42.2 | ||
| Conservative | David John Stirzaker | 1,804 | 30.7 | ||
| UKIP | Joanne Bradley | 1,306 | 22.2 | ||
| Green | Clive James Robert Charles | 290 | 4.9 | ||
| Majority | 674 | 11.5 | |||
| Turnout | 5,878 | ||||
| Labour hold | Swing | ||||
Atherleigh ward
| Party | Candidate | Votes | % | ±% | |
|---|---|---|---|---|---|
| Labour | Mark Aldred | 2,310 | 48.2 | ||
| UKIP | Les Leggett | 1,005 | 21.0 | ||
| Conservative | Paul Lambert Fairhurst | 859 | 17.9 | ||
| Independent | Stuart Andrew Gerrard | 494 | 10.3 | ||
| Left Unity | Stephen Michael Hall | 125 | 2.6 | ||
| Majority | 1,305 | 27.2 | |||
| Turnout | 4,793 | ||||
| Labour hold | Swing | ||||
Golborne and Lowton West ward
| Party | Candidate | Votes | % | ±% | |
|---|---|---|---|---|---|
| Labour | Stuart Arthur Keane | 3,046 | 60.5 | ||
| UKIP | Peter Graham Kearns | 970 | 19.3 | ||
| Conservative | Brian Howard Lobell | 793 | 15.8 | ||
| Community Action | Sophie Aspey | 225 | 4.5 | ||
| Majority | 2,076 | 41.2 | |||
| Turnout | 5,034 | ||||
| Labour hold | Swing | ||||
Leigh East ward
| Party | Candidate | Votes | % | ±% | |
|---|---|---|---|---|---|
| Labour | Anita Thorpe | 2,949 | 58.4 | ||
| UKIP | Gill Gibson | 1,088 | 21.6 | ||
| Conservative | Richard Byrom Houlton | 888 | 17.6 | ||
| Left Unity | Graham Gifford | 123 | 2.4 | ||
| Majority | 1,861 | 36.8 | |||
| Turnout | 5,048 | ||||
| Labour hold | Swing | ||||
Leigh South ward
| Party | Candidate | Votes | % | ±% | |
|---|---|---|---|---|---|
| Labour | John David O'Brien | 3,200 | 51.3 | ||
| UKIP | Rod Halliwell | 1,547 | 24.8 | ||
| Conservative | Denise Young | 1,358 | 21.8 | ||
| Left Unity | Ian Heyes | 135 | 2.2 | ||
| Majority | 1,653 | 26.5 | |||
| Turnout | 6,240 | ||||
| Labour hold | Swing | ||||
Leigh West ward
| Party | Candidate | Votes | % | ±% | |
|---|---|---|---|---|---|
| Labour | Myra Joan Whiteside | 3,066 | 56.7 | ||
| UKIP | Mary Therese Lavelle | 1,418 | 26.2 | ||
| Conservative | Andrew John Oxley | 645 | 11.9 | ||
| Green | Paula Unger | 278 | 5.1 | ||
| Majority | 1,648 | 30.5 | |||
| Turnout | 5,407 | ||||
| Labour hold | Swing | ||||
Lowton East ward
| Party | Candidate | Votes | % | ±% | |
|---|---|---|---|---|---|
| Conservative | Kath Houlton | 3,228 | 50.3 | ||
| Labour | Pam Gilligan | 2,579 | 40.2 | ||
| Independent | Sandy Franzen | 609 | 9.5 | ||
| Majority | 649 | 10.1 | |||
| Turnout | 6,416 | ||||
| Conservative gain from Labour | Swing | ||||
Tyldesley ward
| Party | Candidate | Votes | % | ±% | |
|---|---|---|---|---|---|
| Labour | Stephen John Hellier | 2,780 | 45.2 | ||
| UKIP | Matthew Robert James | 1,530 | 24.9 | ||
| Conservative | Sue Vickery | 1,198 | 19.5 | ||
| Liberal Democrats | Lorraine Gillon | 353 | 5.7 | ||
| Green | Graham Unsworth | 283 | 4.6 | ||
| Majority | 1,250 | 20.3 | |||
| Turnout | 6,144 | ||||
| Labour hold | Swing | ||||
Abram ward
| Party | Candidate | Votes | % | ±% | |
|---|---|---|---|---|---|
| Labour | Eunice Smethurst | 3,217 | 59.0 | ||
| UKIP | Jim Carmichael-Prince | 1,584 | 28.4 | ||
| Conservative | Joanne Bradley | 653 | 12.0 | ||
| Majority | 1,633 | 30.6 | |||
| Turnout | 5,454 | ||||
| Labour hold | Swing | ||||
Ashton ward
| Party | Candidate | Votes | % | ±% | |
|---|---|---|---|---|---|
| Labour | Jennifer Bullen | 2,738 | 49.0 | ||
| UKIP | Alan Freeman | 950 | 17.0 | ||
| Conservative | Marie Winstanley | 833 | 14.9 | ||
| Community Action | Michael Moulding | 749 | 13.4 | ||
| Independent | Peter Merry | 318 | 5.7 | ||
| Majority | 1,788 | 32.0 | |||
| Turnout | 5,588 | ||||
| Labour hold | Swing | ||||
Bryn ward
| Party | Candidate | Votes | % | ±% | |
|---|---|---|---|---|---|
| Labour | Nathan George Murray | 2,245 | 39.4 | ||
| Independent | Gary Thomas Wilkes | 1,717 | 30.1 | ||
| UKIP | Stephen Jones | 948 | 16.6 | ||
| Conservative | Judith Anderson | 378 | 6.6 | ||
| Independent | David Wilkes | 267 | 4.7 | ||
| Community Action | Catherine Aspey | 141 | 2.5 | ||
| Majority | 528 | 9.2 | |||
| Turnout | 5,696 | ||||
| Labour gain from Independent | Swing | ||||
Hindley ward
| Party | Candidate | Votes | % | ±% | |
|---|---|---|---|---|---|
| Labour | James Eccles-Churton | 2,975 | 54.7 | ||
| UKIP | Sue Ellis | 1,457 | 26.8 | ||
| Conservative | Susan Atherton | 712 | 13.1 | ||
| Liberal Democrats | John Charles Skipworth | 295 | 5.4 | ||
| Majority | 1,518 | 27.9 | |||
| Turnout | 5,439 | ||||
| Labour hold | Swing | ||||
Hindley Green ward
| Party | Candidate | Votes | % | ±% | |
|---|---|---|---|---|---|
| Labour | Frank Carmichael | 2,839 | 55.2 | ||
| UKIP | Sandra Margaret Atherton | 1,520 | 29.5 | ||
| Conservative | Gerard Joseph Houlton | 788 | 15.3 | ||
| Majority | 1,319 | 25.7 | |||
| Turnout | 5,147 | ||||
| Labour gain from Independent | Swing | ||||
Orrell ward
| Party | Candidate | Votes | % | ±% | |
|---|---|---|---|---|---|
| Labour | Steve Murphy | 2,812 | 44.3 | ||
| Conservative | Michael William Winstanley | 2,257 | 35.5 | ||
| UKIP | Philip Easton | 950 | 15.0 | ||
| Green | David Stazicker | 325 | 5.1 | ||
| Majority | 545 | 8.8 | |||
| Turnout | 6,354 | ||||
| Labour hold | Swing | ||||
Winstanley ward
| Party | Candidate | Votes | % | ±% | |
|---|---|---|---|---|---|
| Labour | Marie Teresa Morgan | 2,898 | 49.0 | ||
| UKIP | Andrew Francis Collinson | 1,437 | 24.3 | ||
| Conservative | Allan Atherton | 1,182 | 20.0 | ||
| Green | Steven Charles Heyes | 398 | 6.7 | ||
| Majority | 1,461 | 24.7 | |||
| Turnout | 5,915 | ||||
| Labour hold | Swing | ||||
Worsley Mesnes ward
| Party | Candidate | Votes | % | ±% | |
|---|---|---|---|---|---|
| Labour | Billy Rotherham | 3,039 | 59.4 | ||
| UKIP | Maureen McCoy | 1,332 | 26.0 | ||
| Conservative | Stephen Gerard Holt | 566 | 11.1 | ||
| Green | Norma Stout | 182 | 3.6 | ||
| Majority | 1,707 | 33.4 | |||
| Turnout | 5,119 | ||||
| Labour hold | Swing | ||||
Aspull, New Springs and Whelley ward
| Party | Candidate | Votes | % | ±% | |
|---|---|---|---|---|---|
| Labour | Chris Ready | 3,534 | 55.3 | ||
| UKIP | Mark Andrew Bradley | 1,416 | 22.2 | ||
| Conservative | Jane Surples | 1,282 | 20.1 | ||
| Left Unity | John Stuart Bolton | 156 | 2.4 | ||
| Majority | 2,118 | 33.2 | |||
| Turnout | 6,388 | 63.3 | |||
| Labour hold | Swing | ||||
Douglas ward
| Party | Candidate | Votes | % | ±% | |
|---|---|---|---|---|---|
| Labour | Michael Anthony Dewhurst | 3,145 | 64.2 | ||
| UKIP | Derek Wilkes | 1,130 | 23.1 | ||
| Conservative | Margaret Atherton | 525 | 10.7 | ||
| Left Unity | Adele Joanne Andrews | 98 | 2.0 | ||
| Majority | 2,015 | 41.1 | |||
| Turnout | 4,898 | 50.2 | |||
| Labour hold | Swing | ||||
Ince ward
| Party | Candidate | Votes | % | ±% | |
|---|---|---|---|---|---|
| Labour | Janice Sharratt | 2,937 | 64.1 | ||
| UKIP | Ross Allan Wright | 1,192 | 26.0 | ||
| Conservative | Callum Chadwick | 352 | 7.7 | ||
| Left Unity | Janet Elizabeth Phillips | 100 | 2.2 | ||
| Majority | 1,745 | 38.1 | |||
| Turnout | 4,581 | 50.6 | |||
| Labour hold | Swing | ||||
Pemberton ward
| Party | Candidate | Votes | % | ±% | |
|---|---|---|---|---|---|
| Labour | Sam Marc Murphy | 3,154 | 62.9 | ||
| UKIP | Daniel Stephen Wood | 1,099 | 21.9 | ||
| Conservative | Claire Houlton | 547 | 10.9 | ||
| Green | Will Patterson | 212 | 4.2 | ||
| Majority | 2,055 | 41.0 | |||
| Turnout | 5,012 | 50.6 | |||
| Labour hold | Swing | ||||
Shevington with Lower Ground ward
| Party | Candidate | Votes | % | ±% | |
|---|---|---|---|---|---|
| Labour | Paul Anthony Collins | 2,717 | 43.5 | ||
| Conservative | David Ollerton | 1,661 | 26.6 | ||
| UKIP | Arnold Jefferson Foster | 1,439 | 23.1 | ||
| Green | Joseph Rylance | 426 | 6.8 | ||
| Majority | 1,056 | 16.9 | |||
| Turnout | 6,243 | 67.5 | |||
| Labour hold | Swing | ||||
Standish with Langtree ward
| Party | Candidate | Votes | % | ±% | |
|---|---|---|---|---|---|
| Standish Independents | George Allan Fairhurst | 1,999 | 30.3 | ||
| Conservative | Ray Whittingham | 1,848 | 28.0 | ||
| Labour | Debbie Parkinson | 1,735 | 26.3 | ||
| UKIP | Emma Josephine Appleton | 923 | 14.0 | ||
| TUSC | Sharon Holden | 99 | 1.4 | ||
| Majority | 151 | 2.3 | |||
| Turnout | 6,604 | 68.0 | |||
| Standish Independents hold | Swing | ||||
Wigan Central ward
| Party | Candidate | Votes | % | ±% | |
|---|---|---|---|---|---|
| Labour | Michael McLoughlin | 2,783 | 46.9 | ||
| Conservative | Jean Margaret Peet | 1,391 | 23.4 | ||
| UKIP | Keith Robert Jones | 1,228 | 20.7 | ||
| Green | Damien Hendry | 443 | 7.5 | ||
| Independent | Brian Parr | 90 | 1.5 | ||
| Majority | 1,392 | 23.5 | |||
| Turnout | 5,935 | 63.8 | |||
| Labour hold | Swing | ||||
Wigan West ward
| Party | Candidate | Votes | % | ±% | |
|---|---|---|---|---|---|
| Labour | Steve Dawber | 3,500 | 62.1 | ||
| UKIP | Janet Markland | 1,203 | 21.3 | ||
| Conservative | Jamie Vickery | 727 | 12.9 | ||
| Left Unity | Hazel Elizabeth Duffy | 207 | 3.7 | ||
| Majority | 2,297 | 40.7 | |||
| Turnout | 5,637 | 57.5 | |||
| Labour hold | Swing | ||||
References
- "Upcoming elections & referendums". The Electoral Commission. Archived from the original on 15 March 2015. Retrieved 26 March 2015.
- "Local Election Results". apps.wigan.gov.uk.
This article is issued from Wikipedia. The text is licensed under Creative Commons - Attribution - Sharealike. Additional terms may apply for the media files.