1986 Harlow District Council election
The 1986 Harlow District Council election took place on 8 May 1986 to elect members of Harlow District Council in Essex, England. This was on the same day as other local elections. The Labour Party retained control of the council.
| |||||||||||||||||||||||||||||||||||||
14 of the 42 seats to Harlow District Council 22 seats needed for a majority | |||||||||||||||||||||||||||||||||||||
|---|---|---|---|---|---|---|---|---|---|---|---|---|---|---|---|---|---|---|---|---|---|---|---|---|---|---|---|---|---|---|---|---|---|---|---|---|---|
| |||||||||||||||||||||||||||||||||||||
 Map showing the results of contested wards in the 1986 Harlow District Council elections. | |||||||||||||||||||||||||||||||||||||
| |||||||||||||||||||||||||||||||||||||
Election result
| Party | Seats | Gains | Losses | Net gain/loss | Seats % | Votes % | Votes | +/− | |
|---|---|---|---|---|---|---|---|---|---|
| Labour | 13 | 2 | 0 | 92.9 | 61.8 | 12,987 | |||
| Alliance | 1 | 0 | 1 | 7.1 | 22.9 | 4,819 | |||
| Conservative | 0 | 0 | 1 | 0.0 | 15.3 | 3,224 | |||
All comparisons in vote share are to the corresponding 1982 election.
Ward results
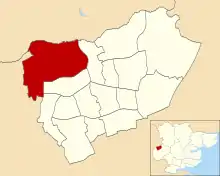
Brays Grove
Location of Brays Grove ward
| Party | Candidate | Votes | % | |
|---|---|---|---|---|
| Labour | D. Howard | 838 | 72.8% | |
| Conservative | T. Owen | 166 | 14.4% | |
| Alliance | S. Rigden | 147 | 12.8% | |
| Turnout | 34.3% | |||
| Labour hold | ||||
Hare Street and Town Centre

Location of Hare Street and Town Centre ward
| Party | Candidate | Votes | % | |
|---|---|---|---|---|
| Labour | P. Larkin | 818 | 68.5% | |
| Alliance | N. Lincoln | 223 | 18.7% | |
| Conservative | N. Dean | 154 | 12.9% | |
| Turnout | 39.9% | |||
| Labour hold | ||||
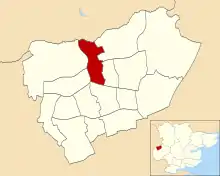
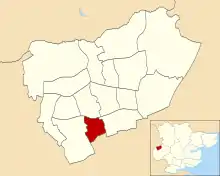
Katherines With Sumner
Location of Katherines with Sumner ward
| Party | Candidate | Votes | % | |
|---|---|---|---|---|
| Labour | H. Bryant | 871 | 53.2% | |
| Alliance | K. Clark | 508 | 31.1% | |
| Conservative | L. Atkins | 257 | 15.7% | |
| Turnout | 37.5% | |||
| Labour gain from Alliance | ||||
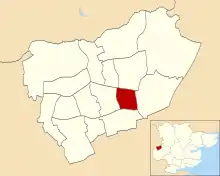
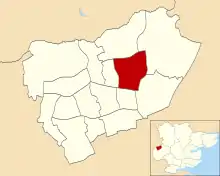
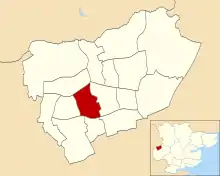
Kingsmoor
Location of Kingsmoor ward
| Party | Candidate | Votes | % | |
|---|---|---|---|---|
| Labour | P. Lynch | 923 | 49.8% | |
| Conservative | R. Cross | 665 | 35.9% | |
| Alliance | L. Swanton | 265 | 14.3% | |
| Turnout | 38.7% | |||
| Labour gain from Conservative | ||||
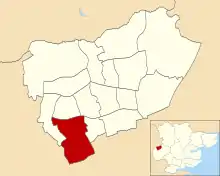
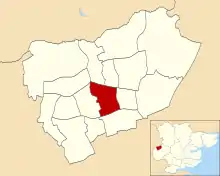
Latton Bush
Location of Latton Bush ward
| Party | Candidate | Votes | % | |
|---|---|---|---|---|
| Labour | Bill Rammell | 1,080 | 64.9% | |
| Alliance | R. Langham | 352 | 21.2% | |
| Conservative | M. Tombs | 231 | 13.9% | |
| Turnout | 39.4% | |||
| Labour hold | ||||
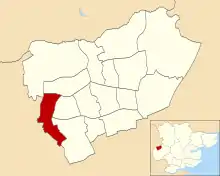
Little Parndon
Location of Little Parndon ward
| Party | Candidate | Votes | % | |
|---|---|---|---|---|
| Labour | M. Carter | 1,083 | 66.2% | |
| Alliance | R. Winkie | 311 | 19.0% | |
| Conservative | E. Atkins | 242 | 14.8% | |
| Turnout | 39.2% | |||
| Labour hold | ||||
Mark Hall North

Location of Mark Hall North ward
| Party | Candidate | Votes | % | |
|---|---|---|---|---|
| Labour | E. Morris | 678 | 61.7% | |
| Conservative | C. Starr | 230 | 20.9% | |
| Alliance | M. Seddon | 190 | 17.3% | |
| Turnout | 47.7% | |||
| Labour hold | ||||
Mark Hall South
Location of Mark Hall South ward
| Party | Candidate | Votes | % | |
|---|---|---|---|---|
| Labour | S. Anderson | 1,092 | 69.4% | |
| Conservative | K. Smart | 247 | 15.7% | |
| Alliance | S. Ward | 235 | 14.9% | |
| Turnout | 38.8% | |||
| Labour hold | ||||
Netteswell West
Location of Netteswell West ward
| Party | Candidate | Votes | % | |
|---|---|---|---|---|
| Labour | R. Nash | 635 | 71.3% | |
| Alliance | M. Rigden | 138 | 15.5% | |
| Conservative | E. Scammell | 117 | 13.1% | |
| Turnout | 36.2% | |||
| Labour hold | ||||
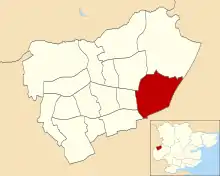
Old Harlow
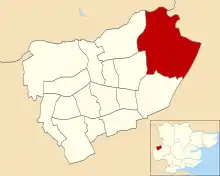
Location of Old Harlow ward
| Party | Candidate | Votes | % | |
|---|---|---|---|---|
| Labour | S. Firth | 1,359 | 60.0% | |
| Conservative | F. Lawman | 610 | 26.9% | |
| Alliance | H. Dutton | 295 | 13.0% | |
| Turnout | 49.9% | |||
| Labour hold | ||||
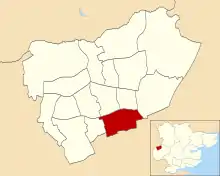
Passmores
Location of Passmores ward
| Party | Candidate | Votes | % | |
|---|---|---|---|---|
| Labour | M. Collyer | 920 | 66.5% | |
| Alliance | D. Harris | 249 | 18.0% | |
| Conservative | D. Groves | 215 | 15.5% | |
| Turnout | 33.1% | |||
| Labour hold | ||||
Potter Street
Location of Potter Street ward
| Party | Candidate | Votes | % | |
|---|---|---|---|---|
| Labour | J. Cave | 848 | 59.3% | |
| Alliance | A. Lee | 461 | 32.3% | |
| Conservative | C. Dean | 120 | 8.4% | |
| Turnout | 44.1% | |||
| Labour hold | ||||
References
- "Council compositions by year". The Elections Centre.
- "Local Election Summaries 1986". The Elections Centre.
- "Harlow District Council Election Results 1976-2012" (PDF). Elections Centre. Retrieved 27 September 2019.
| London boroughs |
|
|---|---|
| Metropolitan boroughs |
|
| District councils (England) |
|
| Regional councils (Scotland) |
|
| LEAs | |
This article is issued from Wikipedia. The text is licensed under Creative Commons - Attribution - Sharealike. Additional terms may apply for the media files.