2010 Epping Forest District Council election
The 2010 Epping Forest District Council election took place on 6 May 2010 to elect members of Epping Forest District Council in England. This was on the same day as other 2010 United Kingdom general election.
| |||||||||||||||||||||||||||||||||||||||||||||||||||||||||||||||||||||||||||||||||||||||||||||
20 of 58 seats on Epping Forest District Council 30 seats needed for a majority | |||||||||||||||||||||||||||||||||||||||||||||||||||||||||||||||||||||||||||||||||||||||||||||
|---|---|---|---|---|---|---|---|---|---|---|---|---|---|---|---|---|---|---|---|---|---|---|---|---|---|---|---|---|---|---|---|---|---|---|---|---|---|---|---|---|---|---|---|---|---|---|---|---|---|---|---|---|---|---|---|---|---|---|---|---|---|---|---|---|---|---|---|---|---|---|---|---|---|---|---|---|---|---|---|---|---|---|---|---|---|---|---|---|---|---|---|---|---|
| Turnout | 67.0 ( | ||||||||||||||||||||||||||||||||||||||||||||||||||||||||||||||||||||||||||||||||||||||||||||
| |||||||||||||||||||||||||||||||||||||||||||||||||||||||||||||||||||||||||||||||||||||||||||||
 Results of the 2010 District Council elections | |||||||||||||||||||||||||||||||||||||||||||||||||||||||||||||||||||||||||||||||||||||||||||||
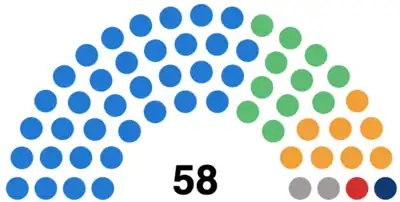 Council seat composition after the election | |||||||||||||||||||||||||||||||||||||||||||||||||||||||||||||||||||||||||||||||||||||||||||||
| |||||||||||||||||||||||||||||||||||||||||||||||||||||||||||||||||||||||||||||||||||||||||||||
Ward Results
Figures are compared to the last time these seats were contested in any election cycle for the Epping Forest District Council election, this is indicated.
Buckhurst Hill East
| Party | Candidate | Votes | % | ±% | |
|---|---|---|---|---|---|
| Liberal Democrats | Peter Spencer | 1,136 | 50.0 | ||
| Conservative | Marshall Vance | 957 | 42.1 | ||
| Green | Steven Neville | 180 | 7.9 | N/A | |
| Majority | 179 | 7.9 | |||
| Turnout | 2,273 | 65.8 | |||
| Liberal Democrats hold | Swing | ||||
Buckhurst Hill West
| Party | Candidate | Votes | % | ±% | |
|---|---|---|---|---|---|
| Conservative | Sylvia Watson | 1,827 | 47.2 | ||
| Liberal Democrats | Ann Haigh | 1,775 | 45.9 | ||
| UKIP | Gerard Wadsworth | 153 | 4.0 | N/A | |
| Green | Ben Wille | 112 | 2.9 | N/A | |
| Majority | 52 | 1.3 | |||
| Turnout | 3,867 | 72.4 | |||
| Conservative gain from Liberal Democrats | Swing | ||||
Chigwell Village
| Party | Candidate | Votes | % | ±% | |
|---|---|---|---|---|---|
| Conservative | Lesley Wagland | 1,608 | 72.1 | ||
| Liberal Democrats | Eleonor Spencer | 442 | 19.8 | ||
| Green | Christopher Lord | 180 | 8.1 | ||
| Majority | 1,166 | 52.3 | |||
| Turnout | 2,230 | 68.4 | |||
| Conservative hold | Swing | ||||
Chipping Ongar, Greensted and Marden Ash
| Party | Candidate | Votes | % | ±% | |
|---|---|---|---|---|---|
| Liberal Democrats | Derek Jacobs | 1,076 | 39.1 | ||
| Conservative | Blane Judd | 974 | 35.4 | ||
| Conservative | Paul Keska | 957 | N/A | ||
| Liberal Democrats | Keith Wright | 748 | N/A | ||
| Green | Amy Barnecutt | 251 | 9.1 | N/A | |
| Independent | Sheila Jackman | 231 | 8.4 | N/A | |
| English Democrat | Robin Tilbrook | 220 | 8.0 | ||
| Turnout | 4,381 | 68.4 | |||
| Liberal Democrats hold | Swing | ||||
| Conservative hold | Swing | ||||
Epping Hemnall
| Party | Candidate | Votes | % | ±% | |
|---|---|---|---|---|---|
| Liberal Democrats | Janet Whitehouse | 1,632 | 46.5 | ||
| Conservative | Kenneth Avey | 1,348 | 38.4 | ||
| Labour | Michael Finan | 234 | 6.7 | ||
| UKIP | Andrew Smith | 232 | 6.6 | N/A | |
| Green | Jem Barnecutt | 62 | 1.8 | ||
| Majority | 284 | 8.1 | |||
| Turnout | 3,508 | 71.4 | |||
| Liberal Democrats hold | Swing | ||||
Epping Lindsey and Thornwood Common
| Party | Candidate | Votes | % | ±% | |
|---|---|---|---|---|---|
| Conservative | Will Breare-Hall | 1,692 | 49.3 | ||
| Liberal Democrats | Lorraine Collier | 1,264 | 36.9 | ||
| Labour | Simon Bullough | 341 | 9.9 | ||
| Green | Barry Johns | 133 | 3.9 | ||
| Majority | 428 | 12.5 | |||
| Turnout | 3,430 | 71.4 | |||
| Conservative hold | Swing | ||||
Grange Hill
| Party | Candidate | Votes | % | ±% | |
|---|---|---|---|---|---|
| Conservative | Gagan Mohindra | 1,676 | 54.7 | ||
| Liberal Democrats | Gavin Chambers | 1,173 | 38.3 | ||
| Green | Vikki Meier | 216 | 7.0 | N/A | |
| Majority | 504 | 16.4 | 50.6 | ||
| Turnout | 3,430 | 71.4 | |||
| Conservative hold | Swing | ||||
Loughton Alderton
| Party | Candidate | Votes | % | ±% | |
|---|---|---|---|---|---|
| Loughton Residents | Lance Leonard | 1,016 | 48.1 | ||
| Conservative | Edward Stacey | 397 | 18.8 | ||
| BNP | Edward Long | 328 | 15.5 | ||
| Labour | Tom Owen | 237 | 11.2 | ||
| Liberal Democrats | Neil Woollcott | 135 | 6.4 | ||
| Majority | 619 | 29.3 | |||
| Turnout | 2,113 | 62.7 | |||
| Loughton Residents gain from BNP | Swing | ||||
Loughton Broadway
| Party | Candidate | Votes | % | ±% | |
|---|---|---|---|---|---|
| Loughton Residents | Jennie Hart | 605 | 32.9 | ||
| Labour | Margaret Owen | 384 | 20.9 | ||
| Conservative | Ben Glassman | 354 | 19.3 | ||
| BNP | Thomas Richardson | 323 | 17.6 | ||
| Liberal Democrats | Enid Robinson | 172 | 9.4 | ||
| Majority | 221 | 12.0 | |||
| Turnout | 1,838 | 57.0 | |||
| Loughton Residents gain from BNP | Swing | ||||
Loughton Fairmead
| Party | Candidate | Votes | % | ±% | |
|---|---|---|---|---|---|
| Loughton Residents | Tessa Cochrane | 750 | 38.8 | ||
| Conservative | Neil Cohen | 472 | 24.4 | ||
| BNP | Alexander Copeland | 300 | 15.5 | ||
| Labour | John Game | 229 | 11.8 | ||
| Liberal Democrats | Simon Hughes | 182 | 9.4 | ||
| Majority | 278 | 14.4 | |||
| Turnout | 1,933 | 59.1 | 22.5 | ||
| Loughton Residents gain from BNP | Swing | ||||
Loughton Forest
| Party | Candidate | Votes | % | ±% | |
|---|---|---|---|---|---|
| Loughton Residents | Colin Finn | 1,093 | 43.8 | ||
| Conservative | Lorne Daniel | 1,069 | 42.9 | ||
| Liberal Democrats | Angela Cass | 257 | 10.3 | ||
| Green | Simon Pepper | 75 | 3.0 | N/A | |
| Majority | 24 | 0.9 | |||
| Turnout | 2,494 | 73.0 | |||
| Loughton Residents hold | Swing | ||||
Loughton Roding
| Party | Candidate | Votes | % | ±% | |
|---|---|---|---|---|---|
| Independent | Stephen Murray | 1,720 | 70.5 | N/A | |
| Conservative | Iqbal Singh Kalkat | 373 | 15.3 | ||
| Liberal Democrats | Deborah Buckley | 186 | 7.6 | ||
| BNP | Ryan Hazell | 160 | 6.6 | ||
| Majority | 1,347 | 55.2 | |||
| Turnout | 2,439 | 68.8 | |||
| Independent hold | Swing | ||||
Loughton St. John's
| Party | Candidate | Votes | % | ±% | |
|---|---|---|---|---|---|
| Loughton Residents | John Markham | 1,325 | 53.1 | ||
| Conservative | Roger Taylor | 787 | 31.5 | ||
| Liberal Democrats | Peter Sinfield | 165 | 6.6 | ||
| Labour | Jill Bostock | 163 | 6.5 | ||
| Green | Linda Coombes | 56 | 2.2 | N/A | |
| Majority | 538 | 21.6 | |||
| Turnout | 2,496 | 72.1 | |||
| Loughton Residents hold | Swing | ||||
Loughton St. Mary's
| Party | Candidate | Votes | % | ±% | |
|---|---|---|---|---|---|
| Loughton Residents | Richard Cohen | 1,239 | 54.1 | ||
| Conservative | Mitchell Cohen | 777 | 33.9 | ||
| Liberal Democrats | Peter Fuller | 185 | 8.1 | ||
| Green | Jesse Briton | 88 | 3.8 | N/A | |
| Majority | 462 | 21.6 | |||
| Turnout | 2,289 | 69.7 | |||
| Loughton Residents gain from Conservative | Swing | ||||
Lower Nazeing
| Party | Candidate | Votes | % | ±% | |
|---|---|---|---|---|---|
| Conservative | Yolanda Knight | 1,476 | 66.6 | ||
| Labour | Kelvin Morris | 153 | 12.4 | ||
| Independent | Toni Cooper | 250 | 11.3 | ||
| Liberal Democrats | Ingrid Black | 176 | 7.9 | N/A | |
| Green | Alison Garnham | 41 | 1.8 | N/A | |
| Majority | 1,202 | 54.2 | |||
| Turnout | 2,217 | 69.0 | |||
| Conservative hold | Swing | ||||
North Weald Bassett
| Party | Candidate | Votes | % | ±% | |
|---|---|---|---|---|---|
| Conservative | Dave Stallan | 1,682 | 71.5 | ||
| Liberal Democrats | George Howard | 511 | 21.7 | ||
| Green | Nicola Harries | 159 | 6.8 | N/A | |
| Majority | 1,171 | 49.8 | |||
| Turnout | 2,352 | 67.0 | |||
| Conservative hold | Swing | ||||
Theydon Bois
| Party | Candidate | Votes | % | ±% | |
|---|---|---|---|---|---|
| Conservative | Sue Jones | 1,242 | 51.7 | ||
| Liberal Democrats | Roland Frankel | 1,066 | 44.4 | ||
| Green | Daniel Kieve | 95 | 4.0 | ||
| Majority | 176 | 7.3 | |||
| Turnout | 2,403 | 74.1 | |||
| Conservative gain from Liberal Democrats | Swing | ||||
Waltham Abbey Honey Lane
| Party | Candidate | Votes | % | ±% | |
|---|---|---|---|---|---|
| Conservative | David Johnson | 1,662 | 61.5 | ||
| Liberal Democrats | Lee Tant | 824 | 30.5 | ||
| Green | Jessica Barnecutt | 218 | 8.1 | N/A | |
| Majority | 838 | 31.0 | |||
| Turnout | 2,704 | 74.1 | |||
| Conservative hold | Swing | ||||
Waltham Abbey Paternoster
| Party | Candidate | Votes | % | ±% | |
|---|---|---|---|---|---|
| Conservative | John Wyatt | 1,030 | 58.3 | ||
| Liberal Democrats | Philip Chadburn | 554 | 31.3 | N/A | |
| Green | Pauline Gradden | 184 | 10.4 | N/A | |
| Majority | 476 | 26.9 | |||
| Turnout | 1,768 | 53.6 | |||
| Conservative hold | Swing | ||||
References
- "Election results by party, 6 May 2010". www.eppingforestdc.gov.uk. 6 May 2010.
This article is issued from Wikipedia. The text is licensed under Creative Commons - Attribution - Sharealike. Additional terms may apply for the media files.