1992 Colchester Borough Council election
Elections to Colchester Borough Council took place in May 1992. These were on the same day as other local elections across the United Kingdom.
20 out of 60 seats to Colchester Borough Council 31 seats needed for a majority | |||||||||||||||||||||||||||||||||||||||||||||||||||||||||||
|---|---|---|---|---|---|---|---|---|---|---|---|---|---|---|---|---|---|---|---|---|---|---|---|---|---|---|---|---|---|---|---|---|---|---|---|---|---|---|---|---|---|---|---|---|---|---|---|---|---|---|---|---|---|---|---|---|---|---|---|
| Turnout | 39.8% ( | ||||||||||||||||||||||||||||||||||||||||||||||||||||||||||
| |||||||||||||||||||||||||||||||||||||||||||||||||||||||||||
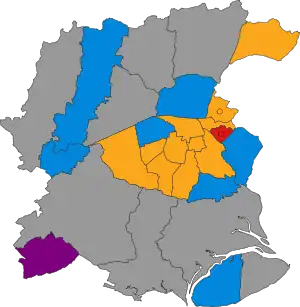 Winner of each seat at the 1992 Colchester Borough Council election | |||||||||||||||||||||||||||||||||||||||||||||||||||||||||||
| |||||||||||||||||||||||||||||||||||||||||||||||||||||||||||
Summary
| 1992 Colchester Borough Council election | ||||||||||
|---|---|---|---|---|---|---|---|---|---|---|
| Party | This election | Full council | This election | |||||||
| Seats | Net | Seats % | Other | Total | Total % | Votes | Votes % | +/− | ||
| Liberal Democrats | 12 | 54.5 | 17 | 29 | 47.5 | 17,668 | 41.7 | +1.8 | ||
| Conservative | 7 | 31.8 | 14 | 21 | 35.6 | 15,937 | 37.6 | +2.6 | ||
| Labour | 2 | 9.1 | 6 | 8 | 13.6 | 7,125 | 16.8 | –3.6 | ||
| Tiptree Residents | 1 | 4.5 | 1 | 2 | 3.4 | 1,102 | 2.6 | +0.9 | ||
| Green | 0 | 0.0 | 0 | 0 | 0.0 | 577 | 1.4 | –0.8 | ||
Ward results
Berechurch
| Party | Candidate | Votes | % | ±% | |
|---|---|---|---|---|---|
| Liberal Democrats | John William Stevens | 1,193 | 55.3 | +0.6 | |
| Conservative | N. Peckston | 492 | 22.8 | +6.0 | |
| Labour | Dave Harris | 451 | 20.9 | -6.0 | |
| Green | Walter Schwartz | 22 | 1.0 | -1.5 | |
| Majority | 701 | 32.5 | +4.7 | ||
| Turnout | 2,158 | 37.3 | -5.7 | ||
| Registered electors | 5,784 | ||||
| Liberal Democrats hold | Swing | ||||
Castle
| Party | Candidate | Votes | % | ±% | |
|---|---|---|---|---|---|
| Liberal Democrats | William Spyvee | 1,023 | 41.6 | -8.2 | |
| Labour | Ken Cooke | 740 | 30.1 | +6.6 | |
| Conservative | H. Day | 644 | 26.2 | +3.6 | |
| Green | S. Newton | 50 | 2.0 | -2.1 | |
| Majority | 283 | 11.5 | -14.8 | ||
| Turnout | 2,457 | 45.1 | -0.9 | ||
| Registered electors | 5,448 | ||||
| Liberal Democrats gain from Labour | Swing | ||||
Dedham
| Party | Candidate | Votes | % | ±% | |
|---|---|---|---|---|---|
| Liberal Democrats | G. Williams | 503 | 54.2 | -3.3 | |
| Conservative | Christopher Manning-Press | 401 | 43.2 | +6.2 | |
| Labour | J. Coombes | 24 | 2.6 | -2.9 | |
| Majority | 98 | 11.0 | -9.5 | ||
| Turnout | 928 | 61.0 | -0.3 | ||
| Registered electors | 1,521 | ||||
| Liberal Democrats hold | Swing | ||||
East Donyland
| Party | Candidate | Votes | % | ±% | |
|---|---|---|---|---|---|
| Conservative | D. Holmes | 448 | 44.6 | +9.5 | |
| Labour | B. Wilding* | 384 | 38.2 | -2.1 | |
| Liberal Democrats | Barry Woodward | 160 | 15.9 | -8.7 | |
| Green | S. Morton | 13 | 1.3 | N/A | |
| Majority | 64 | 6.4 | N/A | ||
| Turnout | 1,005 | 58.7 | +5.4 | ||
| Registered electors | 1,711 | ||||
| Conservative gain from Labour | Swing | ||||
Fordham
| Party | Candidate | Votes | % | ±% | |
|---|---|---|---|---|---|
| Conservative | David Cannon | 459 | 58.5 | +3.0 | |
| Liberal Democrats | P. Morris | 225 | 28.7 | +11.9 | |
| Labour | Richard Bourne | 100 | 12.8 | -14.9 | |
| Majority | 234 | 29.8 | +2.0 | ||
| Turnout | 784 | 54.3 | -1.3 | ||
| Registered electors | 1,444 | ||||
| Conservative hold | Swing | ||||
Harbour
| Party | Candidate | Votes | % | ±% | |
|---|---|---|---|---|---|
| Liberal Democrats | Edna Fowler | 1,234 | 56.0 | +18.8 | |
| Labour | S. Manning-Press | 530 | 24.0 | -19.4 | |
| Conservative | S. Cockell | 410 | 18.6 | +1.9 | |
| Green | P. Hitchin | 30 | 1.4 | -0.8 | |
| Majority | 704 | 31.9 | N/A | ||
| Turnout | 2,204 | 37.9 | -4.1 | ||
| Registered electors | 5,818 | ||||
| Liberal Democrats hold | Swing | ||||
Lexden
| Party | Candidate | Votes | % | ±% | |
|---|---|---|---|---|---|
| Conservative | Sonia Lewis | 1,244 | 50.0 | +3.7 | |
| Liberal Democrats | W. Sandford | 1,122 | 45.1 | -2.7 | |
| Labour | L. Barrett | 102 | 4.1 | 0.0 | |
| Green | D. Smith | 19 | 0.8 | -1.0 | |
| Majority | 122 | 4.9 | N/A | ||
| Turnout | 2,487 | 57.2 | +0.2 | ||
| Registered electors | 4,348 | ||||
| Conservative gain from Liberal Democrats | Swing | ||||
Marks Tey
| Party | Candidate | Votes | % | ±% | |
|---|---|---|---|---|---|
| Conservative | R. Gower | 440 | 51.2 | +9.2 | |
| Liberal Democrats | S. Ambridge | 269 | 31.3 | +1.6 | |
| Labour | Julie Young | 150 | 17.5 | -10.8 | |
| Majority | 171 | 19.9 | +7.6 | ||
| Turnout | 859 | 42.8 | -8.6 | ||
| Registered electors | 2,007 | ||||
| Conservative hold | Swing | ||||
Mile End
| Party | Candidate | Votes | % | ±% | |
|---|---|---|---|---|---|
| Conservative | P. Borges | 1,455 | 56.2 | +7.5 | |
| Liberal Democrats | B. Trusler | 794 | 30.7 | -0.9 | |
| Labour | J. Evans | 282 | 10.9 | -5.6 | |
| Green | T. Carvell | 57 | 2.2 | -0.9 | |
| Majority | 661 | 25.5 | +8.4 | ||
| Turnout | 2,588 | 36.2 | -6.8 | ||
| Registered electors | 7,158 | ||||
| Conservative hold | Swing | ||||
New Town
| Party | Candidate | Votes | % | ±% | |
|---|---|---|---|---|---|
| Liberal Democrats | J. Stevens | 1,228 | 58.4 | -4.2 | |
| Labour | S. Sharp | 529 | 25.2 | +1.9 | |
| Conservative | S. Rowley | 282 | 13.4 | +3.9 | |
| Green | B. Mordin | 62 | 3.0 | -1.5 | |
| Majority | 699 | 33.3 | -6.0 | ||
| Turnout | 2,101 | 40.7 | -2.3 | ||
| Registered electors | 5,160 | ||||
| Liberal Democrats hold | Swing | ||||
Prettygate
| Party | Candidate | Votes | % | ±% | |
|---|---|---|---|---|---|
| Liberal Democrats | Martin Hunt | 1,583 | 55.3 | +10.3 | |
| Conservative | W. Kimberley | 1,036 | 36.2 | -4.5 | |
| Labour | T. Pearson | 224 | 7.8 | -4.3 | |
| Green | Dorothy Schwarz | 18 | 0.6 | -2.0 | |
| Majority | 547 | 19.1 | +15.1 | ||
| Turnout | 2,861 | 49.4 | -4.6 | ||
| Registered electors | 5,794 | ||||
| Liberal Democrats hold | Swing | ||||
Shrub End
| Party | Candidate | Votes | % | ±% | |
|---|---|---|---|---|---|
| Liberal Democrats | S. Cawley | 977 | 71.3 | +17.7 | |
| Conservative | S. Wilson | 393 | 28.7 | +9.2 | |
| Majority | 584 | 42.6 | +14.6 | ||
| Turnout | 1,370 | 23.2 | -5.9 | ||
| Registered electors | 5,908 | ||||
| Liberal Democrats hold | Swing | ||||
No Green (2.3%) or Labour (24.6%) candidates as previous.
St. Andrew's
| Party | Candidate | Votes | % | ||
|---|---|---|---|---|---|
| Labour | Robert Newman | 586 | 47.0 | ||
| Labour | Tim Young | 514 | 41.3 | ||
| Liberal Democrats | J. Gamble | 427 | 34.3 | ||
| Conservative | G. Newman | 365 | 29.3 | ||
| Conservative | E. Winney | 300 | 24.1 | ||
| Green | J. Buller | 89 | 7.1 | ||
| Turnout | 1,246 | 24.7 | |||
| Registered electors | 5,946 | ||||
| Labour hold | |||||
| Labour hold | |||||
St. Anne's
| Party | Candidate | Votes | % | ±% | |
|---|---|---|---|---|---|
| Liberal Democrats | J. Fellows | 1,008 | 46.3 | -5.6 | |
| Labour | K. Hindle | 789 | 36.2 | +1.4 | |
| Conservative | N. Elcombe | 358 | 16.4 | +4.8 | |
| Green | J. Van Every | 24 | 1.1 | -0.6 | |
| Majority | 219 | 10.1 | -7.0 | ||
| Turnout | 2,179 | 37.4 | -5.6 | ||
| Registered electors | 5,833 | ||||
| Liberal Democrats hold | Swing | ||||
St. John's
| Party | Candidate | Votes | % | ||
|---|---|---|---|---|---|
| Liberal Democrats | Ray Gamble | 1,410 | 54.8 | ||
| Liberal Democrats | E. Crunden | 1,361 | 52.9 | ||
| Conservative | E. Hamilton | 947 | 36.8 | ||
| Conservative | N. Taylor | 921 | 35.8 | ||
| Labour | D. Betteridge | 147 | 5.7 | ||
| Green | B. Smith | 71 | 2.8 | ||
| Turnout | 2,574 | 45.1 | |||
| Registered electors | 5,708 | ||||
| Liberal Democrats hold | |||||
| Liberal Democrats hold | |||||
St. Mary's
| Party | Candidate | Votes | % | ±% | |
|---|---|---|---|---|---|
| Liberal Democrats | H. Chamberlain | 1,175 | 48.9 | +10.8 | |
| Conservative | Nigel Chapman | 967 | 40.3 | -1.8 | |
| Labour | R. Turp | 218 | 9.1 | -6.9 | |
| Green | J. Carvell | 42 | 1.7 | -2.1 | |
| Majority | 208 | 8.7 | N/A | ||
| Turnout | 2,402 | 46.1 | +2.1 | ||
| Registered electors | 5,216 | ||||
| Liberal Democrats gain from Conservative | Swing | ||||
Stanway
| Party | Candidate | Votes | % | ±% | |
|---|---|---|---|---|---|
| Liberal Democrats | Colin Sykes | 1,335 | 56.7 | +3.3 | |
| Conservative | J. Orpen-Smellie | 826 | 35.1 | +1.6 | |
| Labour | E. Plowright | 194 | 8.2 | -7.8 | |
| Majority | 509 | 21.6 | +1.8 | ||
| Turnout | 2,355 | 41.1 | -3.9 | ||
| Registered electors | 5.734 | ||||
| Liberal Democrats hold | Swing | ||||
Tiptree
| Party | Candidate | Votes | % | ±% | |
|---|---|---|---|---|---|
| Tiptree Residents | John Webb | 1,102 | 46.3 | +14.6 | |
| Conservative | M. Hope | 1,025 | 43.1 | -3.0 | |
| Labour | A. Atxtell | 251 | 10.6 | -11.5 | |
| Majority | 77 | 3.2 | -11.2 | ||
| Turnout | 2,378 | 39.9 | +0.9 | ||
| Registered electors | 6,069 | ||||
| Tiptree Residents hold | Swing | ||||
West Mersea
| Party | Candidate | Votes | % | ±% | |
|---|---|---|---|---|---|
| Conservative | J. Stewart | 1,398 | 75.2 | +11.2 | |
| Liberal Democrats | G. Maynard | 328 | 17.6 | +3.1 | |
| Labour | G. Newman | 133 | 7.2 | -2.4 | |
| Majority | 1,070 | 57.6 | +8.1 | ||
| Turnout | 1,859 | 33.6 | -9.4 | ||
| Registered electors | 5,538 | ||||
| Conservative hold | Swing | ||||
No Independent candidate as previous (11.9%).
Wivenhoe
| Party | Candidate | Votes | % | ±% | |
|---|---|---|---|---|---|
| Conservative | C. Thompson | 1,129 | 48.5 | +7.4 | |
| Labour | S. Sharp | 777 | 33.4 | -4.3 | |
| Liberal Democrats | I. O'Mahoney | 313 | 13.4 | -2.4 | |
| Green | M. Paterson | 110 | 4.7 | -0.7 | |
| Majority | 352 | 15.1 | +11.7 | ||
| Turnout | 2,329 | 38.5 | -5.5 | ||
| Registered electors | 6,052 | ||||
| Conservative gain from Labour | Swing | ||||
References
| Metropolitan boroughs |
|
|---|---|
| District councils (England) |
|
| District councils (Scotland) |
|
| |
This article is issued from Wikipedia. The text is licensed under Creative Commons - Attribution - Sharealike. Additional terms may apply for the media files.