1987 Harlow District Council election
The 1987 Harlow District Council election took place on 7 May 1987 to elect members of Harlow District Council in Essex, England. This was on the same day as other local elections. The Labour Party retained control of the council.
| |||||||||||||||||||||||||||||||||
14 of the 42 seats to Harlow District Council 22 seats needed for a majority | |||||||||||||||||||||||||||||||||
|---|---|---|---|---|---|---|---|---|---|---|---|---|---|---|---|---|---|---|---|---|---|---|---|---|---|---|---|---|---|---|---|---|---|
| |||||||||||||||||||||||||||||||||
 Map showing the results of contested wards in the 1987 Harlow District Council elections. | |||||||||||||||||||||||||||||||||
| |||||||||||||||||||||||||||||||||
Election result
| Party | Seats | Gains | Losses | Net gain/loss | Seats % | Votes % | Votes | +/− | |
|---|---|---|---|---|---|---|---|---|---|
| Labour | 11 | 1 | 0 | 78.6 | 49.6 | 12,082 | |||
| Conservative | 2 | 0 | 0 | 14.3 | 26.5 | 6,469 | |||
| Alliance | 1 | 0 | 1 | 7.1 | 23.6 | 5,755 | |||
| Ind. Conservative | 1 | 0 | 0 | 0.0 | 0.3 | 74 | New | ||
All comparisons in vote share are to the corresponding 1983 election.
Ward results
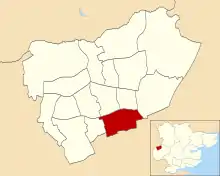
Brays Grove
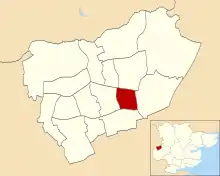
Location of Brays Grove ward
| Party | Candidate | Votes | % | |
|---|---|---|---|---|
| Labour | H. Talbot | 835 | 59.0% | |
| Conservative | V. Petch | 293 | 20.7% | |
| Alliance | E. Scammell | 287 | 20.3% | |
| Turnout | 43.0% | |||
| Labour hold | ||||
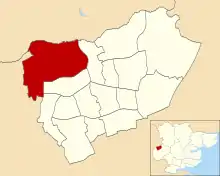
Great Parndon
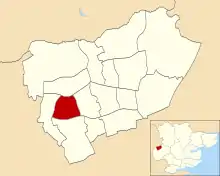
Location of Great Parndon ward
| Party | Candidate | Votes | % | |
|---|---|---|---|---|
| Conservative | P. McClarnon | 876 | 46.4% | |
| Labour | P. Brown | 689 | 36.5% | |
| Alliance | D. Harris | 324 | 17.2% | |
| Turnout | 56.6% | |||
| Conservative hold | ||||
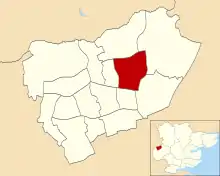
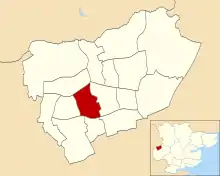
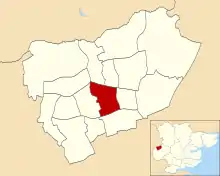
Katherines With Sumner
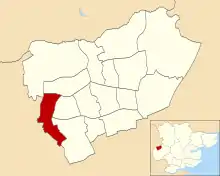
Location of Katherines with Sumner ward
| Party | Candidate | Votes | % | |
|---|---|---|---|---|
| Labour | V. Clark | 800 | 46.2% | |
| Conservative | M. Rigden | 498 | 28.7% | |
| Alliance | P. Barton | 435 | 25.1% | |
| Turnout | 39.2% | |||
| Labour gain from Alliance | ||||
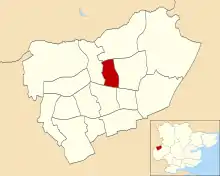
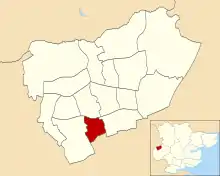
Kingsmoor
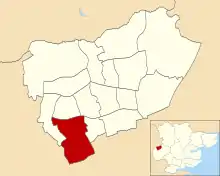
Location of Kingsmoor ward
| Party | Candidate | Votes | % | |
|---|---|---|---|---|
| Conservative | R. Cross | 852 | 41.1% | |
| Labour | D. Law | 812 | 39.2% | |
| Alliance | D. Collins | 408 | 19.7% | |
| Turnout | 43.5% | |||
| Conservative hold | ||||
Latton Bush
Location of Latton Bush ward
| Party | Candidate | Votes | % | |
|---|---|---|---|---|
| Labour | P. Bruce | 1,018 | 57.0% | |
| Conservative | M. Tombs | 446 | 25.0% | |
| Alliance | R. Langham | 321 | 18.0% | |
| Turnout | 42.5% | |||
| Labour hold | ||||
Little Parndon
Location of Little Parndon ward
| Party | Candidate | Votes | % | |
|---|---|---|---|---|
| Labour | S. Warner | 913 | 54.3% | |
| Alliance | E. Atkins | 365 | 21.7% | |
| Conservative | E. Atkins | 328 | 19.5% | |
| Ind. Conservative | T. Hodge | 74 | 4.4% | |
| Turnout | 40.0% | |||
| Labour hold | ||||
Mark Hall North

Location of Mark Hall North ward
| Party | Candidate | Votes | % | |
|---|---|---|---|---|
| Labour | J. McAlpine | 686 | 56.5% | |
| Conservative | S. Rigden | 332 | 27.3% | |
| Alliance | B. Hanks | 196 | 16.1% | |
| Turnout | 53.6% | |||
| Labour hold | ||||
Mark Hall South
Location of Mark Hall South ward
| Party | Candidate | Votes | % | |
|---|---|---|---|---|
| Labour | L. Smith | 1,062 | 60.4% | |
| Alliance | S. Nixon | 362 | 20.6% | |
| Conservative | B. Hill | 334 | 19.0% | |
| Turnout | 44.3% | |||
| Labour hold | ||||
Netteswell East
Location of Netteswell East ward
| Party | Candidate | Votes | % | |
|---|---|---|---|---|
| Labour | A. Garner | 753 | 54.6% | |
| Conservative | I. Crame | 328 | 23.8% | |
| Alliance | V. Scott | 298 | 21.6% | |
| Turnout | 47.0% | |||
| Labour hold | ||||
Old Harlow
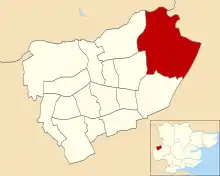
Location of Old Harlow ward
| Party | Candidate | Votes | % | |
|---|---|---|---|---|
| Labour | C. Cochrane | 1,110 | 40.9% | |
| Conservative | N. Hitch | 966 | 35.6% | |
| Alliance | R. Winkie | 636 | 23.5% | |
| Turnout | 60.2% | |||
| Labour hold | ||||
Passmores
Location of Passmores ward
| Party | Candidate | Votes | % | |
|---|---|---|---|---|
| Labour | R. Rowland | 860 | 51.5% | |
| Conservative | L. Atkins | 443 | 26.5% | |
| Alliance | S. Curran | 366 | 21.9% | |
| Turnout | 41.1% | |||
| Labour hold | ||||
Potter Street
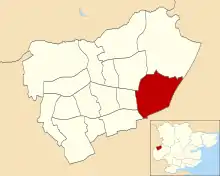
Location of Potter Street ward
| Party | Candidate | Votes | % | |
|---|---|---|---|---|
| Labour | W. Gibson | 928 | 61.0% | |
| Alliance | S. Ward | 352 | 23.1% | |
| Conservative | D. Fleming | 241 | 15.8% | |
| Turnout | 47.4% | |||
| Labour hold | ||||
References
- "Council compositions by year". The Elections Centre.
- "Local Election Summaries 1987". The Elections Centre.
- "Harlow District Council Election Results 1973-2012" (PDF). Elections Centre. Retrieved 27 September 2019.
| Metropolitan boroughs |
|
|---|---|
| District councils (England) |
|
| District councils (Wales) |
|
| |
This article is issued from Wikipedia. The text is licensed under Creative Commons - Attribution - Sharealike. Additional terms may apply for the media files.