1979 Colchester Borough Council election
Elections to Colchester Borough Council were held in 1979 alongside other local elections across the country.
20 out of 60 seats to Colchester Borough Council 31 seats needed for a majority | |||||||||||||||||||||||||||||||||||||||||||||||||||||||||||
|---|---|---|---|---|---|---|---|---|---|---|---|---|---|---|---|---|---|---|---|---|---|---|---|---|---|---|---|---|---|---|---|---|---|---|---|---|---|---|---|---|---|---|---|---|---|---|---|---|---|---|---|---|---|---|---|---|---|---|---|
| Turnout | 73.9% ( | ||||||||||||||||||||||||||||||||||||||||||||||||||||||||||
| |||||||||||||||||||||||||||||||||||||||||||||||||||||||||||
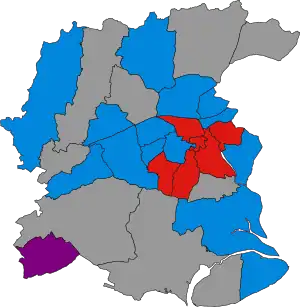 Winner of each seat at the 1979 Colchester Borough Council election | |||||||||||||||||||||||||||||||||||||||||||||||||||||||||||
| |||||||||||||||||||||||||||||||||||||||||||||||||||||||||||
Summary
| 1979 Colchester Borough Council election[1] | ||||||||||
|---|---|---|---|---|---|---|---|---|---|---|
| Party | This election | Full council | This election | |||||||
| Seats | Net | Seats % | Other | Total | Total % | Votes | Votes % | +/− | ||
| Conservative | 13 | 65.0 | 23 | 36 | 60.0 | 30,316 | 50.2 | –2.9 | ||
| Labour | 6 | 30.0 | 15 | 21 | 35.0 | 22,644 | 37.5 | –4.2 | ||
| Tiptree Residents | 1 | 5.0 | 1 | 2 | 3.3 | 2,541 | 4.2 | +2.0 | ||
| Independent | 0 | 0.0 | 1 | 1 | 1.7 | 0 | 0.0 | ±0.0 | ||
| Liberal | 0 | 0.0 | 0 | 0 | 0.0 | 4,867 | 8.1 | +5.1 | ||
Ward results
Berechurch
| Party | Candidate | Votes | % | ±% | |
|---|---|---|---|---|---|
| Labour | C. Howe | 1,941 | 48.0 | +7.5 | |
| Conservative | V. Worth | 1,388 | 34.3 | –1.2 | |
| Liberal | Martin Hunt | 716 | 17.7 | –6.3 | |
| Majority | 553 | 13.7 | +8.7 | ||
| Turnout | 4,045 | 73.5 | +31.9 | ||
| Registered electors | 5,611 | ||||
| Labour hold | Swing | ||||
Castle
| Party | Candidate | Votes | % | ±% | |
|---|---|---|---|---|---|
| Labour | J. Dunn | 1,643 | 46.6 | –10.3 | |
| Conservative | A. Beevers | 1,457 | 41.3 | +4.4 | |
| Liberal | William Spyvee | 425 | 12.1 | +5.9 | |
| Majority | 186 | 5.3 | –14.7 | ||
| Turnout | 3,525 | 73.7 | +23.3 | ||
| Registered electors | 4,861 | ||||
| Labour hold | Swing | ||||
Copford & Eight Ash Green
| Party | Candidate | Votes | % | ±% | |
|---|---|---|---|---|---|
| Conservative | M. Wilde | 1,139 | 73.0 | –3.6 | |
| Labour | V. McAndrew | 422 | 27.0 | +3.6 | |
| Majority | 717 | 45.9 | –7.3 | ||
| Turnout | 1,561 | 78.5 | +30.9 | ||
| Registered electors | 2,012 | ||||
| Conservative hold | Swing | ||||
Great & Little Horksley
| Party | Candidate | Votes | % | ±% | |
|---|---|---|---|---|---|
| Conservative | W. Knighton | 1,086 | 78.1 | N/A | |
| Labour | J. Coombes | 305 | 21.9 | N/A | |
| Majority | 781 | 56.2 | N/A | ||
| Turnout | 1,391 | 80.7 | N/A | ||
| Registered electors | 1,744 | ||||
| Conservative hold | Swing | N/A | |||
Great Tey
| Party | Candidate | Votes | % | ±% | |
|---|---|---|---|---|---|
| Conservative | R. Browning | 912 | 80.6 | N/A | |
| Labour | Jean Quinn | 220 | 19.4 | N/A | |
| Majority | 692 | 61.1 | N/A | ||
| Turnout | 1,132 | 78.7 | N/A | ||
| Registered electors | 1,451 | ||||
| Conservative hold | Swing | N/A | |||
Harbour
| Party | Candidate | Votes | % | ±% | |
|---|---|---|---|---|---|
| Labour | H. Smith | 2,019 | 53.5 | –2.9 | |
| Conservative | M. Coyne | 1,756 | 46.5 | +2.9 | |
| Majority | 263 | 7.0 | –5.9 | ||
| Turnout | 3,775 | 77.1 | +28.3 | ||
| Registered electors | 4,971 | ||||
| Labour gain from Conservative | Swing | ||||
Lexden
| Party | Candidate | Votes | % | ±% | |
|---|---|---|---|---|---|
| Conservative | C. Sargeant | 1,942 | 61.9 | –19.6 | |
| Liberal | Ian Trusler | 690 | 22.0 | N/A | |
| Labour | R. Lown | 504 | 16.1 | –2.4 | |
| Majority | 1,252 | 39.9 | –23.1 | ||
| Turnout | 3,136 | 80.1 | +31.9 | ||
| Registered electors | 3,969 | ||||
| Conservative hold | Swing | N/A | |||
Mile End
| Party | Candidate | Votes | % | ±% | |
|---|---|---|---|---|---|
| Conservative | R. Fulton | 1,619 | 60.5 | –7.3 | |
| Labour | Tim Oxton | 1,059 | 39.5 | +7.3 | |
| Majority | 560 | 20.9 | –14.7 | ||
| Turnout | 2,678 | 75.8 | +30.9 | ||
| Registered electors | 3,579 | ||||
| Conservative hold | Swing | ||||
New Town
| Party | Candidate | Votes | % | ±% | |
|---|---|---|---|---|---|
| Labour | D. Williams | 2,052 | 60.8 | +4.2 | |
| Conservative | L. Leader | 1,323 | 39.2 | +2.0 | |
| Majority | 729 | 21.6 | +2.2 | ||
| Turnout | 3,375 | 75.3 | +30.6 | ||
| Registered electors | 4,548 | ||||
| Labour hold | Swing | ||||
No Liberal candidate as previous (–6.2).
Prettygate
| Party | Candidate | Votes | % | ±% | |
|---|---|---|---|---|---|
| Conservative | F. Klayter | 2,173 | 54.1 | –14.6 | |
| Labour | B. Sawyer | 1,091 | 27.2 | –4.1 | |
| Liberal | M. Fisher | 750 | 18.7 | N/A | |
| Majority | 1,082 | 27.0 | –8.7 | ||
| Turnout | 4,014 | 82.7 | +37.1 | ||
| Registered electors | 4,924 | ||||
| Conservative hold | Swing | ||||
Pyefleet
| Party | Candidate | Votes | % | ±% | |
|---|---|---|---|---|---|
| Conservative | A. Parsonson | 768 | 75.9 | +0.9 | |
| Labour | J. Jopling | 244 | 24.1 | –0.9 | |
| Majority | 524 | 51.8 | +1.8 | ||
| Turnout | 1,012 | 83.5 | +22.3 | ||
| Registered electors | 1,225 | ||||
| Conservative hold | Swing | ||||
Shrub End
| Party | Candidate | Votes | % | ±% | |
|---|---|---|---|---|---|
| Labour | Frank Wilkin | 1,818 | 57.5 | –1.8 | |
| Conservative | M. Nicholls | 1,345 | 42.5 | +1.8 | |
| Majority | 473 | 15.0 | –3.6 | ||
| Turnout | 3,163 | 57.2 | +24.4 | ||
| Registered electors | 5,601 | ||||
| Labour hold | Swing | ||||
St. Andrews
| Party | Candidate | Votes | % | ±% | |
|---|---|---|---|---|---|
| Labour | D. Braddy | 2,668 | 55.2 | –11.8 | |
| Conservative | T. McArdle | 1,570 | 32.5 | –0.5 | |
| Liberal | Y. Holley | 597 | 12.3 | N/A | |
| Majority | 1,098 | 22.7 | –11.3 | ||
| Turnout | 4,835 | 66.8 | +35.9 | ||
| Registered electors | 7,341 | ||||
| Labour hold | Swing | ||||
St. Annes
| Party | Candidate | Votes | % | ±% | |
|---|---|---|---|---|---|
| Conservative | R. Pawsey | 1,649 | 50.1 | +7.0 | |
| Labour | J. Fraser | 1,644 | 49.9 | –7.0 | |
| Majority | 5 | 0.2 | N/A | ||
| Turnout | 3,293 | 76.3 | +34.0 | ||
| Registered electors | 4,389 | ||||
| Conservative gain from Labour | Swing | ||||
St. Johns
| Party | Candidate | Votes | % | ±% | |
|---|---|---|---|---|---|
| Conservative | B. West | 1,782 | 64.3 | –6.4 | |
| Labour | C. Graves | 991 | 35.7 | +6.4 | |
| Majority | 791 | 28.5 | –12.8 | ||
| Turnout | 2,773 | 80.6 | +33.9 | ||
| Registered electors | 3,481 | ||||
| Conservative hold | Swing | ||||
St. Marys
| Party | Candidate | Votes | % | ±% | |
|---|---|---|---|---|---|
| Conservative | P. Spendlove | 2,137 | 59.6 | –6.5 | |
| Labour | K. Taylor | 819 | 22.9 | +2.0 | |
| Liberal | R. Baker | 628 | 17.5 | +4.5 | |
| Majority | 1,318 | 36.8 | –8.4 | ||
| Turnout | 3,584 | 75.9 | +30.9 | ||
| Registered electors | 4,790 | ||||
| Conservative hold | Swing | ||||
Stanway
| Party | Candidate | Votes | % | ±% | |
|---|---|---|---|---|---|
| Conservative | P. Holloway | 1,528 | 53.8 | –0.5 | |
| Labour | D. Rose | 800 | 28.1 | –17.6 | |
| Liberal | M .Livermore | 514 | 18.1 | N/A | |
| Majority | 728 | 25.6 | +17.0 | ||
| Turnout | 2,842 | 78.7 | +30.5 | ||
| Registered electors | 3,661 | ||||
| Conservative hold | Swing | ||||
Tiptree
| Party | Candidate | Votes | % | ±% | |
|---|---|---|---|---|---|
| Tiptree Residents | J. Webb | 2,541 | 58.0 | +20.8 | |
| Conservative | C. Cansdale | 1,294 | 29.5 | –19.3 | |
| Liberal | I. Thurgood | 547 | 12.5 | N/A | |
| Majority | 1,247 | 28.5 | N/A | ||
| Turnout | 4,382 | 77.5 | +42.1 | ||
| Registered electors | 5,653 | ||||
| Tiptree Residents gain from Conservative | Swing | ||||
No Labour candidate as previous (–13.2).
West Mersea
| Party | Candidate | Votes | % | ±% | |
|---|---|---|---|---|---|
| Conservative | J. Williams | 2,645 | 83.5 | –4.0 | |
| Labour | J. Hockenhull | 523 | 16.5 | +4.0 | |
| Majority | 2,131 | 67.1 | –8.0 | ||
| Turnout | 3,177 | 74.0 | +37.3 | ||
| Registered electors | 4,238 | ||||
| Conservative hold | Swing | ||||
Wivenhoe
| Party | Candidate | Votes | % | ±% | |
|---|---|---|---|---|---|
| Conservative | M. Last | 1,889 | 51.1 | +5.1 | |
| Labour | M. Dunne | 1,811 | 48.9 | –5.1 | |
| Majority | 78 | 2.1 | N/A | ||
| Turnout | 3,700 | 75.3 | +31.7 | ||
| Registered electors | 5,004 | ||||
| Conservative hold | Swing | ||||
References
- Colin Rallings; Michael Thrasher. "Colchester Borough Council Election Results 1973-2012" (PDF). www.electionscentre.co.uk. The Election Centre, Plymouth University.
| Metropolitan boroughs |
|
|---|---|
| District councils (England) |
|
| District councils (Wales) |
|
| Referendums | |
This article is issued from Wikipedia. The text is licensed under Creative Commons - Attribution - Sharealike. Additional terms may apply for the media files.