1980 Colchester Borough Council election
The 1980 Colchester Borough Council election to the Colchester Borough Council were held in 1980 alongside other local elections across the country.
20 out of 60 seats to Colchester Borough Council 31 seats needed for a majority | |||||||||||||||||||||||||||||||||||||||||||||||||||||||||||
|---|---|---|---|---|---|---|---|---|---|---|---|---|---|---|---|---|---|---|---|---|---|---|---|---|---|---|---|---|---|---|---|---|---|---|---|---|---|---|---|---|---|---|---|---|---|---|---|---|---|---|---|---|---|---|---|---|---|---|---|
| Turnout | 42.0% ( | ||||||||||||||||||||||||||||||||||||||||||||||||||||||||||
| |||||||||||||||||||||||||||||||||||||||||||||||||||||||||||
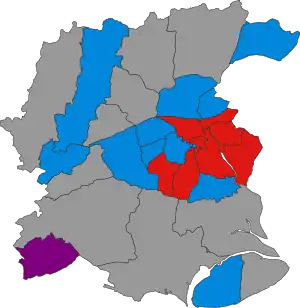 Winner of each seat at the 1980 Colchester Borough Council election | |||||||||||||||||||||||||||||||||||||||||||||||||||||||||||
| |||||||||||||||||||||||||||||||||||||||||||||||||||||||||||
Summary
| 1980 Colchester Borough Council election | ||||||||||
|---|---|---|---|---|---|---|---|---|---|---|
| Party | This election | Full council | This election | |||||||
| Seats | Net | Seats % | Other | Total | Total % | Votes | Votes % | +/− | ||
| Conservative | 9 | 50.0 | 26 | 35 | 58.3 | 15,103 | 44.7 | –5.5 | ||
| Labour | 8 | 44.4 | 14 | 22 | 36.7 | 13,910 | 41.1 | +3.6 | ||
| Tiptree Residents | 1 | 5.6 | 1 | 2 | 3.3 | 1,026 | 3.0 | –1.2 | ||
| Independent | 0 | 0.0 | 1 | 1 | 1.7 | 827 | 2.4 | +0.7 | ||
| Liberal | 0 | 0.0 | 0 | 0 | 0.0 | 2,957 | 8.7 | +0.6 | ||
Ward results
Berechurch
| Party | Candidate | Votes | % | ±% | |
|---|---|---|---|---|---|
| Labour | J. Fraser | 995 | 46.0 | -2.0 | |
| Liberal | M. Gage | 651 | 30.1 | +12.4 | |
| Conservative | C. Roxby | 516 | 23.9 | -10.4 | |
| Majority | 344 | 15.9 | +2.2 | ||
| Turnout | 2,162 | 38.2 | -35.3 | ||
| Registered electors | 5,659 | ||||
| Labour hold | Swing | ||||
Castle
| Party | Candidate | Votes | % | ±% | |
|---|---|---|---|---|---|
| Labour | D. Goodchild | 917 | 45.0 | -1.6 | |
| Conservative | A. Beevers | 839 | 41.2 | -0.1 | |
| Liberal | William Spyvee | 281 | 13.8 | +1.7 | |
| Majority | 78 | 3.8 | -1.5 | ||
| Turnout | 2,037 | 41.3 | -32.4 | ||
| Registered electors | 4,929 | ||||
| Labour hold | Swing | ||||
Dedham
| Party | Candidate | Votes | % | ±% | |
|---|---|---|---|---|---|
| Conservative | J. Jackson | 517 | 68.8 | +1.8 | |
| Liberal | G. Williams | 123 | 16.4 | N/A | |
| Labour | J. Challinor | 112 | 14.9 | N/A | |
| Majority | 394 | 52.4 | +18.4 | ||
| Turnout | 752 | 49.8 | -2.5 | ||
| Registered electors | 1,511 | ||||
| Conservative hold | Swing | N/A | |||
No Independent candidate as previous (-33.0).
East Donyland
| Party | Candidate | Votes | % | ±% | |
|---|---|---|---|---|---|
| Conservative | J. Sanderson | 448 | 57.3 | -0.3 | |
| Labour | E. Lilley | 334 | 42.7 | +0.3 | |
| Majority | 114 | 14.6 | -0.6 | ||
| Turnout | 782 | 58.5 | -8.8 | ||
| Registered electors | 1,337 | ||||
| Conservative hold | Swing | ||||
Fordham
| Party | Candidate | Votes | % | ±% | |
|---|---|---|---|---|---|
| Conservative | C. Menzies | 514 | 65.2 | +10.0 | |
| Labour | H. Bryan | 274 | 34.8 | N/A | |
| Majority | 240 | 30.5 | +20.1 | ||
| Turnout | 788 | 59.7 | -4.1 | ||
| Registered electors | 1,321 | ||||
| Conservative hold | Swing | N/A | |||
No Liberal candidate as previous (-44.8).
Harbour
| Party | Candidate | Votes | % | ±% | |
|---|---|---|---|---|---|
| Labour | J. Bird | 1,424 | 63.1 | +9.6 | |
| Conservative | M. Coyne | 834 | 36.9 | -9.6 | |
| Majority | 590 | 26.1 | +19.1 | ||
| Turnout | 2,258 | 43.8 | -33.3 | ||
| Registered electors | 5,154 | ||||
| Labour hold | Swing | ||||
Lexden
| Party | Candidate | Votes | % | ±% | |
|---|---|---|---|---|---|
| Conservative | J. Wheeler | 1,337 | 64.8 | +2.9 | |
| Liberal | Ian Trusler | 460 | 22.3 | +0.3 | |
| Labour | J. Crawford | 266 | 12.9 | -3.2 | |
| Majority | 877 | 42.5 | +2.6 | ||
| Turnout | 2,063 | 51.4 | -28.7 | ||
| Registered electors | 4,010 | ||||
| Conservative hold | Swing | ||||
Marks Tey
| Party | Candidate | Votes | % | ±% | |
|---|---|---|---|---|---|
| Conservative | E. James | 510 | 57.3 | -20.9 | |
| Labour | D. Brede | 380 | 42.7 | +20.9 | |
| Majority | 130 | 14.6 | -41.8 | ||
| Turnout | 890 | 47.2 | -0.5 | ||
| Registered electors | 1,886 | ||||
| Conservative hold | Swing | ||||
Mile End
| Party | Candidate | Votes | % | ±% | |
|---|---|---|---|---|---|
| Conservative | P. Borges | 991 | 57.3 | -3.2 | |
| Labour | Tim Oxton | 739 | 42.7 | +3.2 | |
| Majority | 252 | 14.6 | -6.3 | ||
| Turnout | 1,730 | 47.4 | -28.4 | ||
| Registered electors | 3,648 | ||||
| Conservative hold | Swing | ||||
New Town
| Party | Candidate | Votes | % | ±% | |
|---|---|---|---|---|---|
| Labour | Bob Russell | 1,354 | 68.3 | +7.5 | |
| Conservative | H. Martin | 411 | 20.7 | -18.5 | |
| Liberal | John Loxley | 218 | 11.0 | N/A | |
| Majority | 943 | 47.6 | +26.0 | ||
| Turnout | 1,983 | 43.7 | -31.6 | ||
| Registered electors | 4,533 | ||||
| Labour hold | Swing | ||||
Prettygate
| Party | Candidate | Votes | % | ±% | |
|---|---|---|---|---|---|
| Conservative | E. Kent | 1,205 | 53.6 | -0.5 | |
| Labour | M. Hedge | 694 | 30.9 | +3.7 | |
| Liberal | Margaret Fisher | 349 | 15.5 | -3.2 | |
| Majority | 511 | 22.7 | -4.3 | ||
| Turnout | 2,248 | 45.2 | -37.5 | ||
| Registered electors | 4,977 | ||||
| Conservative hold | Swing | ||||
Shrub End
| Party | Candidate | Votes | % | ±% | |
|---|---|---|---|---|---|
| Labour | L. Woodrow | 1,103 | 58.1 | +0.6 | |
| Conservative | J. Nicholls | 548 | 28.9 | -13.6 | |
| Liberal | G. Daldry | 246 | 13.0 | N/A | |
| Majority | 555 | 29.2 | +14.2 | ||
| Turnout | 1,897 | 33.1 | -24.1 | ||
| Registered electors | 5,726 | ||||
| Labour hold | Swing | ||||
St. Andrews
| Party | Candidate | Votes | % | ±% | |
|---|---|---|---|---|---|
| Labour | C. Graves | 1,487 | 70.9 | +15.7 | |
| Conservative | Nigel Chapman | 432 | 20.6 | -11.9 | |
| Liberal | R. Baker | 177 | 8.4 | -3.9 | |
| Majority | 1,055 | 50.3 | +27.6 | ||
| Turnout | 2,096 | 27.6 | -39.2 | ||
| Registered electors | 7,592 | ||||
| Labour hold | Swing | ||||
St. Annes
| Party | Candidate | Votes | % | ±% | |
|---|---|---|---|---|---|
| Labour | Mary Frank | 1,227 | 58.3 | +8.4 | |
| Conservative | K. McLean | 876 | 41.7 | -8.4 | |
| Majority | 351 | 16.6 | N/A | ||
| Turnout | 2,103 | 45.8 | -30.5 | ||
| Registered electors | 4,589 | ||||
| Labour hold | Swing | ||||
St. Johns
| Party | Candidate | Votes | % | ±% | |
|---|---|---|---|---|---|
| Conservative | D. Smith | 980 | 64.3 | ±0.0 | |
| Labour | R. Crookes | 544 | 35.7 | ±0.0 | |
| Majority | 436 | 28.6 | ±0.0 | ||
| Turnout | 1,524 | 43.6 | -37.0 | ||
| Registered electors | 3,498 | ||||
| Conservative hold | Swing | ||||
St. Marys
| Party | Candidate | Votes | % | ±% | |
|---|---|---|---|---|---|
| Conservative | J. Brooks | 1,451 | 65.8 | +6.2 | |
| Labour | Pauline Cook | 453 | 20.6 | -2.3 | |
| Liberal | Martin Hunt | 300 | 13.6 | -3.9 | |
| Majority | 998 | 45.2 | +8.4 | ||
| Turnout | 2,204 | 44.0 | -31.9 | ||
| Registered electors | 5,012 | ||||
| Conservative hold | Swing | ||||
Stanway
| Party | Candidate | Votes | % | ±% | |
|---|---|---|---|---|---|
| Conservative | J. Lowater | 834 | 51.4 | -2.4 | |
| Labour | K. Taylor | 637 | 39.2 | +11.1 | |
| Liberal | M. Livermore | 152 | 9.4 | -8.7 | |
| Majority | 197 | 12.2 | -13.4 | ||
| Turnout | 1,623 | 42.8 | -35.9 | ||
| Registered electors | 3,794 | ||||
| Conservative hold | Swing | ||||
Tiptree
| Party | Candidate | Votes | % | ±% | |
|---|---|---|---|---|---|
| Tiptree Residents | E. Bird | 1,026 | 51.6 | -6.4 | |
| Conservative | R. Bearman | 720 | 36.2 | +6.7 | |
| Labour | C. Kent | 244 | 12.3 | N/A | |
| Majority | 306 | 15.4 | -13.1 | ||
| Turnout | 1,990 | 34.7 | -42.8 | ||
| Registered electors | 5,731 | ||||
| Tiptree Residents hold | Swing | ||||
No Liberal candidate as previous (-12.5).
West Mersea
| Party | Candidate | Votes | % | ±% | |
|---|---|---|---|---|---|
| Conservative | L. Leader | 1,121 | 66.1 | -17.4 | |
| Independent | L. Broadhurst | 426 | 25.1 | N/A | |
| Labour | J. Hockenhull | 150 | 8.8 | -7.7 | |
| Majority | 695 | 41.0 | -26.1 | ||
| Turnout | 1,697 | 38.4 | -35.8 | ||
| Registered electors | 4,418 | ||||
| Conservative hold | Swing | N/A | |||
Wivenhoe
| Party | Candidate | Votes | % | ±% | |
|---|---|---|---|---|---|
| Labour | G. Davies | 1,230 | 46.0 | -2.9 | |
| Conservative | D. Wilkinson | 1,043 | 39.0 | -12.1 | |
| Independent | V. Last | 401 | 15.0 | N/A | |
| Majority | 187 | 7.0 | N/A | ||
| Turnout | 2,674 | 50.8 | -24.5 | ||
| Registered electors | 5,267 | ||||
| Labour gain from Conservative | Swing | ||||
References
| Metropolitan boroughs |
|
|---|---|
| District councils (England) |
|
| District councils (Scotland) |
|
This article is issued from Wikipedia. The text is licensed under Creative Commons - Attribution - Sharealike. Additional terms may apply for the media files.