1996 Colchester Borough Council election
Elections to Colchester Borough Council took place on 2 May 1996. They were held on the same day as other local elections across the United Kingdom.
| |||||||||||||||||||||||||||||||||||||||||||||||||||||||||||
20 out of 60 seats to Colchester Borough Council 31 seats needed for a majority | |||||||||||||||||||||||||||||||||||||||||||||||||||||||||||
|---|---|---|---|---|---|---|---|---|---|---|---|---|---|---|---|---|---|---|---|---|---|---|---|---|---|---|---|---|---|---|---|---|---|---|---|---|---|---|---|---|---|---|---|---|---|---|---|---|---|---|---|---|---|---|---|---|---|---|---|
| Turnout | 38.1% ( | ||||||||||||||||||||||||||||||||||||||||||||||||||||||||||
| |||||||||||||||||||||||||||||||||||||||||||||||||||||||||||
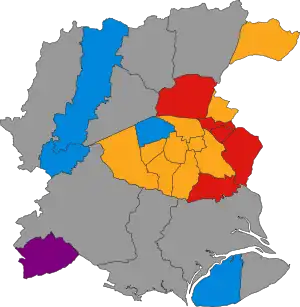 Winner in each seat at the 1996 Colchester Borough Council election | |||||||||||||||||||||||||||||||||||||||||||||||||||||||||||
| |||||||||||||||||||||||||||||||||||||||||||||||||||||||||||
At the election, the Liberal Democrats maintained their majority on the council. The Labour Party made a net gain of 4 seats to displace the Conservatives as the official opposition. This is the first time since the 1984 election that the Labour Party has held the official opposition.
Summary
| 1996 Colchester Borough Council election[1] | ||||||||||
|---|---|---|---|---|---|---|---|---|---|---|
| Party | This election | Full council | This election | |||||||
| Seats | Net | Seats % | Other | Total | Total % | Votes | Votes % | +/− | ||
| Liberal Democrats | 10 | 50.0 | 22 | 32 | 53.3 | 15,202 | 39.9 | +2.1 | ||
| Labour | 5 | 25.0 | 11 | 16 | 26.7 | 13,001 | 34.2 | –1.9 | ||
| Conservative | 4 | 20.0 | 7 | 11 | 18.3 | 8,577 | 22.5 | –2.8 | ||
| Tiptree Residents | 1 | 5.0 | 0 | 1 | 1.7 | 1,085 | 2.9 | N/A | ||
| Ind. Conservative | 0 | 0.0 | 0 | 0 | 0.0 | 174 | 0.5 | N/A | ||
| Natural Law | 0 | 0.0 | 0 | 0 | 0.0 | 22 | 0.1 | N/A | ||
Ward results
Berechurch
| Party | Candidate | Votes | % | ±% | |
|---|---|---|---|---|---|
| Liberal Democrats | John William Stevens* | 1,231 | 50.1 | +1.7 | |
| Labour | O. Bishop | 1,047 | 42.6 | -1.7 | |
| Conservative | N. Peckston | 180 | 7.3 | ±0.0 | |
| Majority | 184 | 7.5 | +3.4 | ||
| Turnout | 2,458 | 43.2 | +1.2 | ||
| Registered electors | 5,700 | ||||
| Liberal Democrats hold | Swing | ||||
Castle
| Party | Candidate | Votes | % | ±% | |
|---|---|---|---|---|---|
| Liberal Democrats | William Spyvee* | 1,076 | 45.6 | +10.4 | |
| Labour | J. Thomas | 895 | 37.9 | -8.4 | |
| Conservative | J. Lucas | 366 | 15.5 | -0.2 | |
| Natural Law | J. Basker | 22 | 0.9 | +0.1 | |
| Majority | 181 | 7.7 | N/A | ||
| Turnout | 2,359 | 41.6 | -2.4 | ||
| Registered electors | 5,679 | ||||
| Liberal Democrats hold | Swing | ||||
No Green candidate as previous (2.0%).
Dedham
| Party | Candidate | Votes | % | ±% | |
|---|---|---|---|---|---|
| Liberal Democrats | G. Williams* | 531 | 57.9 | +3.7 | |
| Conservative | W. Scattergood | 318 | 34.7 | -8.5 | |
| Labour | Dave Harris | 68 | 7.4 | +4.8 | |
| Majority | 213 | 23.2 | +12.2 | ||
| Turnout | 917 | 59.4 | -1.6 | ||
| Registered electors | 1,550 | ||||
| Liberal Democrats hold | Swing | ||||
East Donyland
| Party | Candidate | Votes | % | ±% | |
|---|---|---|---|---|---|
| Labour | Tina Cooke | 402 | 48.4 | +10.2 | |
| Liberal Democrats | Barry Woodward | 245 | 29.5 | +13.6 | |
| Conservative | V. Watson | 149 | 17.9 | -26.7 | |
| Ind. Conservative | D. Newman | 35 | 4.2 | N/A | |
| Majority | 157 | 18.9 | N/A | ||
| Turnout | 831 | 47.8 | -10.9 | ||
| Registered electors | 1,738 | ||||
| Labour gain from Conservative | Swing | ||||
Fordham
| Party | Candidate | Votes | % | ±% | |
|---|---|---|---|---|---|
| Conservative | David Cannon* | 365 | 48.4 | -10.1 | |
| Liberal Democrats | R. Tyrrell | 231 | 30.6 | +1.9 | |
| Labour | J. Coombes | 145 | 19.2 | +6.4 | |
| Ind. Conservative | K. Roberts | 13 | 1.7 | N/A | |
| Majority | 134 | 17.8 | -12.0 | ||
| Turnout | 754 | 51.7 | -2.6 | ||
| Registered electors | 1,465 | ||||
| Conservative hold | Swing | ||||
Harbour
| Party | Candidate | Votes | % | ±% | |
|---|---|---|---|---|---|
| Liberal Democrats | Edna Fowler* | 1,219 | 53.0 | +18.6 | |
| Labour | S. Webb | 906 | 39.4 | -16.4 | |
| Conservative | Mike Coyne | 176 | 7.6 | -2.2 | |
| Majority | 313 | 13.6 | N/A | ||
| Turnout | 2,301 | 37.8 | -2.2 | ||
| Registered electors | 6,088 | ||||
| Liberal Democrats hold | Swing | ||||
No Green candidate as previous (1.4%).
Lexden
| Party | Candidate | Votes | % | ±% | |
|---|---|---|---|---|---|
| Conservative | Sonia Lewis* | 1,098 | 48.3 | +8.7 | |
| Liberal Democrats | B. Trusler | 935 | 41.2 | -6.9 | |
| Labour | P. Creasy | 210 | 9.2 | -3.1 | |
| Ind. Conservative | I. Juliff | 29 | 1.3 | N/A | |
| Majority | 163 | 7.2 | N/A | ||
| Turnout | 2,272 | 52.5 | +1.5 | ||
| Registered electors | 4,337 | ||||
| Conservative hold | Swing | ||||
Marks Tey
| Party | Candidate | Votes | % | ±% | |
|---|---|---|---|---|---|
| Conservative | Richard Gower* | 312 | 34.7 | -16.5 | |
| Labour | T. Rogers | 285 | 31.7 | +14.2 | |
| Liberal Democrats | G. Ambridge | 275 | 30.6 | -0.7 | |
| Ind. Conservative | G. Francis | 27 | 3.0 | N/A | |
| Majority | 27 | 3.0 | -16.9 | ||
| Turnout | 899 | 44.3 | +1.5 | ||
| Registered electors | 2,028 | ||||
| Conservative hold | Swing | ||||
Mile End
| Party | Candidate | Votes | % | ±% | |
|---|---|---|---|---|---|
| Labour | Lucy Wood | 1,089 | 37.0 | +1.1 | |
| Conservative | P. Borges* | 900 | 30.5 | -0.9 | |
| Liberal Democrats | G. Folkard | 887 | 30.1 | -0.7 | |
| Ind. Conservative | D. Pallett | 70 | 2.4 | N/A | |
| Majority | 189 | 6.4 | +1.9 | ||
| Turnout | 2,946 | 33.2 | -2.8 | ||
| Registered electors | 8,875 | ||||
| Labour gain from Conservative | Swing | ||||
New Town
| Party | Candidate | Votes | % | ±% | |
|---|---|---|---|---|---|
| Liberal Democrats | Jenny Stevens* | 1,178 | 62.7 | +3.8 | |
| Labour | C. Tighe | 576 | 30.6 | -2.8 | |
| Conservative | J. Girdlestone | 126 | 6.7 | +1.5 | |
| Majority | 602 | 32.0 | +6.5 | ||
| Turnout | 1,880 | 36.8 | -4.2 | ||
| Registered electors | 5,112 | ||||
| Liberal Democrats hold | Swing | ||||
No Green candidate as previous (2.5%).
Prettygate
| Party | Candidate | Votes | % | ±% | |
|---|---|---|---|---|---|
| Liberal Democrats | Martin Hunt | 1,164 | 48.3 | -1.0 | |
| Labour | F. Somerville | 629 | 26.1 | -0.5 | |
| Conservative | Ron Levy | 615 | 25.5 | +1.4 | |
| Majority | 535 | 22.2 | -0.5 | ||
| Turnout | 2,408 | 40.6 | -1.4 | ||
| Registered electors | 5,904 | ||||
| Liberal Democrats hold | Swing | ||||
Shrub End
| Party | Candidate | Votes | % | ±% | |
|---|---|---|---|---|---|
| Liberal Democrats | Steve Cawley* | 687 | 49.8 | +7.4 | |
| Labour | A. Frost | 529 | 38.4 | -8.4 | |
| Conservative | R. Bunn | 163 | 11.8 | +1.0 | |
| Majority | 158 | 11.5 | N/A | ||
| Turnout | 1,379 | 28.7 | -0.3 | ||
| Registered electors | 4,806 | ||||
| Liberal Democrats hold | Swing | ||||
St. Andrew's
| Party | Candidate | Votes | % | ±% | |
|---|---|---|---|---|---|
| Labour | Robert Newman | 776 | 61.0 | -6.2 | |
| Liberal Democrats | John Gray | 388 | 30.5 | +3.5 | |
| Conservative | D. Smith | 109 | 8.6 | +2.8 | |
| Majority | 388 | 30.5 | -9.7 | ||
| Turnout | 1,273 | 23.6 | -7.4 | ||
| Registered electors | 5,397 | ||||
| Labour hold | Swing | ||||
St. Anne's
| Party | Candidate | Votes | % | ±% | |
|---|---|---|---|---|---|
| Labour | Mary Frank | 1,124 | 50.7 | +6.1 | |
| Liberal Democrats | J. Fellows* | 937 | 42.2 | -6.8 | |
| Conservative | M. Miller | 157 | 7.1 | +0.7 | |
| Majority | 187 | 8.4 | N/A | ||
| Turnout | 2,218 | 40.1 | -0.9 | ||
| Registered electors | 5,534 | ||||
| Labour gain from Liberal Democrats | Swing | ||||
St. John's
| Party | Candidate | Votes | % | ±% | |
|---|---|---|---|---|---|
| Liberal Democrats | Ray Gamble* | 1,324 | 59.8 | +9.5 | |
| Conservative | N. Taylor | 538 | 24.3 | -1.3 | |
| Labour | John Cooke | 353 | 15.9 | -8.2 | |
| Majority | 786 | 35.5 | +10.8 | ||
| Turnout | 2,215 | 38.9 | -0.1 | ||
| Registered electors | 5,697 | ||||
| Liberal Democrats hold | Swing | ||||
St. Mary's
| Party | Candidate | Votes | % | ±% | |
|---|---|---|---|---|---|
| Liberal Democrats | J. Kirchner | 983 | 45.8 | +2.5 | |
| Conservative | R. Pawsey | 718 | 33.4 | +1.2 | |
| Labour | K. Hindle | 447 | 20.8 | -3.7 | |
| Majority | 265 | 12.3 | +1.2 | ||
| Turnout | 2,148 | 43.2 | +0.2 | ||
| Registered electors | 5,047 | ||||
| Liberal Democrats hold | Swing | ||||
Stanway
| Party | Candidate | Votes | % | ±% | |
|---|---|---|---|---|---|
| Liberal Democrats | Colin Sykes* | 1,100 | 53.9 | +0.3 | |
| Labour | Julie Young | 535 | 26.2 | +1.7 | |
| Conservative | J. Orpen-Smellie | 405 | 19.9 | -2.0 | |
| Majority | 565 | 27.7 | -1.4 | ||
| Turnout | 2,040 | 34.4 | -1.6 | ||
| Registered electors | 5,936 | ||||
| Liberal Democrats hold | Swing | ||||
Tiptree
| Party | Candidate | Votes | % | ±% | |
|---|---|---|---|---|---|
| Tiptree Residents | Tony Webb* | 1,085 | 48.2 | N/A | |
| Labour | Mike Dale | 947 | 42.0 | +0.1 | |
| Conservative | Elizabeth Blundell | 221 | 9.8 | -28.1 | |
| Majority | 138 | 6.1 | N/A | ||
| Turnout | 2,253 | 36.8 | -2.2 | ||
| Registered electors | 6,122 | ||||
| Tiptree Residents hold | Swing | N/A | |||
West Mersea
| Party | Candidate | Votes | % | ±% | |
|---|---|---|---|---|---|
| Conservative | John Jowers* | 1,089 | 54.9 | -6.0 | |
| Liberal Democrats | M. Hargreaves | 458 | 23.1 | +8.5 | |
| Labour | Alan Mogridge | 436 | 22.0 | -2.5 | |
| Majority | 631 | 31.8 | -4.5 | ||
| Turnout | 1,983 | 35.5 | +1.5 | ||
| Registered electors | 5,634 | ||||
| Conservative hold | Swing | ||||
Wivenhoe
| Party | Candidate | Votes | % | ±% | |
|---|---|---|---|---|---|
| Labour | Tom Prosser* | 1,235 | 58.8 | +2.7 | |
| Conservative | P. Osbourne | 583 | 27.8 | -3.1 | |
| Liberal Democrats | P. Gentry | 282 | 13.4 | +4.5 | |
| Majority | 652 | 31.0 | +5.9 | ||
| Turnout | 2,100 | 34.1 | -4.9 | ||
| Registered electors | 6,127 | ||||
| Labour gain from Conservative | Swing | ||||
No Green candidate as previous (4.1%).
By-elections
Dedham
| Party | Candidate | Votes | % | ±% | |
|---|---|---|---|---|---|
| Conservative | 374 | 45.8 | +11.1 | ||
| Liberal Democrats | 352 | 43.1 | -14.8 | ||
| Labour | 91 | 11.1 | +3.7 | ||
| Majority | 22 | 2.7 | N/A | ||
| Turnout | 817 | 51.9 | -7.5 | ||
| Conservative gain from Liberal Democrats | Swing | ||||
References
- "Colchester Borough Council Election Results 1973-2012" (PDF). Colin Rallings and Michael Thrasher. Retrieved 24 December 2022.
- "Local Authority Byelection Results - September 1997". Archived from the original on 11 March 2010. Retrieved 24 December 2022.
{{cite web}}: CS1 maint: bot: original URL status unknown (link)
| Metropolitan boroughs |
|
|---|---|
| Unitary authorities |
|
| District councils |
|
| Ad-hoc election | |
This article is issued from Wikipedia. The text is licensed under Creative Commons - Attribution - Sharealike. Additional terms may apply for the media files.