1980 Harlow District Council election
The 1980 Harlow District Council election took place on 1 May 1980 to elect members of Harlow District Council in Essex, England. This was on the same day as other local elections. The Labour Party retained control of the council.
| |||||||||||||||||||||||||||||||||
15 of the 42 seats to Harlow District Council 23 seats needed for a majority | |||||||||||||||||||||||||||||||||
|---|---|---|---|---|---|---|---|---|---|---|---|---|---|---|---|---|---|---|---|---|---|---|---|---|---|---|---|---|---|---|---|---|---|
| |||||||||||||||||||||||||||||||||
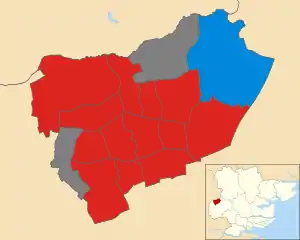 Map showing the results of contested wards in the 1980 Harlow District Council elections. | |||||||||||||||||||||||||||||||||
| |||||||||||||||||||||||||||||||||
Election result
| Party | Seats | Gains | Losses | Net gain/loss | Seats % | Votes % | Votes | +/− | |
|---|---|---|---|---|---|---|---|---|---|
| Labour | 14 | 1 | 0 | 93.3 | 62.3 | 12,365 | |||
| Conservative | 1 | 0 | 0 | 6.7 | 24.7 | 4,891 | |||
| Liberal | 0 | 0 | 1 | 0.0 | 12.8 | 2,537 | |||
| National Front | 0 | 0 | 0 | 0.0 | 0.2 | 48 | |||
Ward results
Brays Grove
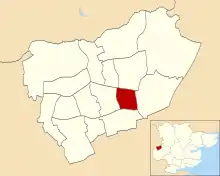
Location of Brays Grove ward
| Party | Candidate | Votes | % | |
|---|---|---|---|---|
| Labour | D. Burnham | 775 | 75.0% | |
| Conservative | M. Ashcroft | 258 | 25.0% | |
| Turnout | 31.0% | |||
| Labour hold | ||||
Great Parndon
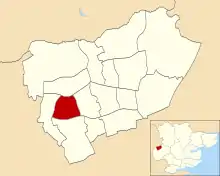
Location of Great Parndon ward
| Party | Candidate | Votes | % | |
|---|---|---|---|---|
| Labour | J. Cave | 837 | 61.4% | |
| Conservative | R. Weyers | 412 | 30.2% | |
| Liberal | T. Owen | 114 | 8.4% | |
| Turnout | 41.0% | |||
| Labour hold | ||||
Hare Street and Town Centre

Location of Hare Street and Town Centre ward
| Party | Candidate | Votes | % | |
|---|---|---|---|---|
| Labour | J. Hobbs | 689 | 64.6% | |
| Conservative | E. Atkins | 243 | 22.8% | |
| Liberal | A. Merryweather | 135 | 12.7% | |
| Turnout | 35.1% | |||
| Labour hold | ||||
Kingsmoor
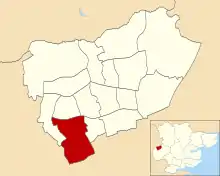
Location of Kingsmoor ward
| Party | Candidate | Votes | % | |
|---|---|---|---|---|
| Labour | T. Kent | 863 | 53.9% | |
| Conservative | L. Atkins | 617 | 38.5% | |
| Liberal | L. Swanton | 122 | 7.6% | |
| Turnout | 35.2% | |||
| Labour hold | ||||
Latton Bush
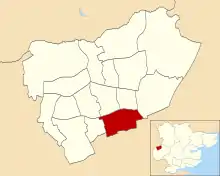
Location of Latton Bush ward
| Party | Candidate | Votes | % | |
|---|---|---|---|---|
| Labour | K. Edwards | 1,172 | 68.8% | |
| Conservative | R. Brown | 428 | 25.1% | |
| Liberal | C. Merryweather | 104 | 6.1% | |
| Turnout | 40.2% | |||
| Labour hold | ||||
Little Parndon
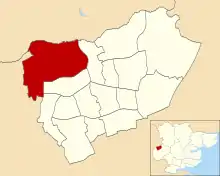
Location of Little Parndon ward
| Party | Candidate | Votes | % | |
|---|---|---|---|---|
| Labour | D. Condon | 1,008 | 60.2% | |
| Conservative | M. Tombs | 338 | 20.2% | |
| Liberal | P. Ramsay | 329 | 19.6% | |
| Turnout | 38.5% | |||
| Labour hold | ||||
Mark Hall South
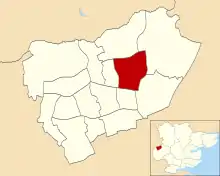
Location of Mark Hall South ward
| Party | Candidate | Votes | % | |
|---|---|---|---|---|
| Labour | T. Farr | 967 | 69.0% | |
| Liberal | J. Mercer | 435 | 31.0% | |
| Turnout | 59.6% | |||
| Labour hold | ||||
Netteswell East
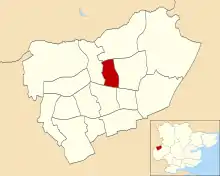
Location of Netteswell East ward
| Party | Candidate | Votes | % | |
|---|---|---|---|---|
| Labour | A. Graham | 741 | 68.0% | |
| Conservative | P. Harries | 268 | 24.6% | |
| Liberal | D. Eldridge | 81 | 7.4% | |
| Turnout | 35.8% | |||
| Labour hold | ||||
Netteswell West
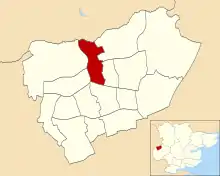
Location of Netteswell West ward
| Party | Candidate | Votes | % | |
|---|---|---|---|---|
| Labour | J. Desormeaux | 628 | 68.2% | |
| Conservative | F. Burgoyne | 175 | 19.0% | |
| Liberal | W. Mitchell | 118 | 12.8% | |
| Turnout | 37.3% | |||
| Labour hold | ||||
Old Harlow
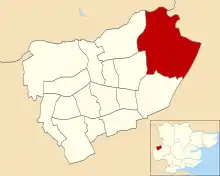
Location of Old Harlow ward
| Party | Candidate | Votes | % | |
|---|---|---|---|---|
| Conservative | H. Dutton | 1,166 | 50.3% | |
| Labour | S. Firth | 1,151 | 49.7% | |
| Turnout | 51.0% | |||
| Conservative hold | ||||
Passmores
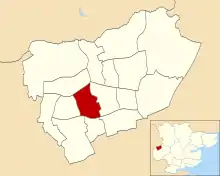
Location of Passmores ward
| Party | Candidate | Votes | % | |
|---|---|---|---|---|
| Labour | A. Jones | 846 | 60.2% | |
| Conservative | C. Brown | 340 | 24.2% | |
| Liberal | D. Filler | 219 | 15.6% | |
| Turnout | % | |||
| Labour hold | ||||
Potter Street
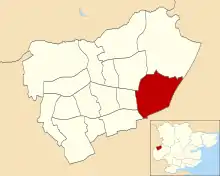
Location of Potter Street ward
| Party | Candidate | Votes | % | |
|---|---|---|---|---|
| Labour | V. Phelps | 907 | 73.2% | |
| Conservative | L. Crust | 200 | 16.1% | |
| Liberal | S. Ward | 132 | 10.7% | |
| Turnout | 38.7% | |||
| Labour hold | ||||
Stewards
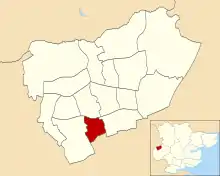
Location of Stewards ward
| Party | Candidate | Votes | % | |
|---|---|---|---|---|
| Labour | H. Talbot | 794 | 48.9% | |
| Liberal | J. Hewitt | 608 | 37.4% | |
| Conservative | R. Cross | 223 | 13.7% | |
| Turnout | 41.3% | |||
| Labour gain from Liberal | ||||
Tye Green (2 seats)
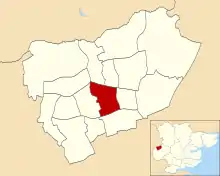
Location of Tye Green ward
| Party | Candidate | Votes | % | |
|---|---|---|---|---|
| Labour | A. James | 987 | ||
| Labour | J. Ellis | 964 | ||
| Conservative | E. Gibson | 223 | ||
| Conservative | S. Tombs | 195 | ||
| Liberal | L. Fuller | 140 | ||
| Liberal | M. Ramsey | 128 | ||
| National Front | C. Saunders | 48 | ||
| Turnout | 35.9% | |||
| Labour hold | ||||
| Labour hold | ||||
References
- "Council compositions by year". The Elections Centre.
- "Local Election Summaries 1980". The Elections Centre.
- "Harlow District Council Election Results 1973-2012" (PDF). Elections Centre. Retrieved 27 September 2019.
This article is issued from Wikipedia. The text is licensed under Creative Commons - Attribution - Sharealike. Additional terms may apply for the media files.