2015 Solihull Metropolitan Borough Council election
The 2015 Solihull Metropolitan Borough Council election took place on 7 May 2015 to elect members of the Solihull Metropolitan Borough Council in England.[1][2] It was held on the same day as other local elections and on the same day as the General Election.
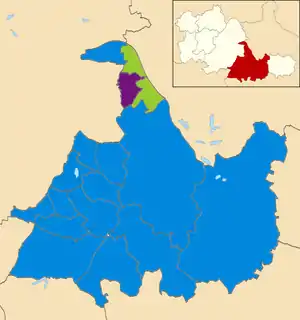
2015 local election results in Solihull
The Conservative Party won every seat with 3 exceptions (The Green Party held Chelmsley Wood and Smith's Wood, and UKIP gained Kingshurst and Fordbridge from Labour).
Ward Results
Bickenhill
| Party | Candidate | Votes | % | ±% | |
|---|---|---|---|---|---|
| Conservative | Bob Sleigh | 3,185 | 54.4 | ||
| UKIP | Gerald Blake | 1214 | 20.7 | ||
| Labour | Mike Longfield | 1061 | 18.1 | ||
| Green | Gary Macnaughton | 397 | 6.8 | ||
| Majority | 1971 | 33.7 | |||
| Turnout | 5880 | 62.3 | |||
| Conservative hold | Swing | ||||
Blythe
| Party | Candidate | Votes | % | ±% | |
|---|---|---|---|---|---|
| Conservative | Ken Hawkins | 5,302 | 74.1 | ||
| Green | Jo Hodgson | 1014 | 14.2 | ||
| Labour | Sardul Marwa | 839 | 11.7 | ||
| Majority | 4288 | 59.9 | |||
| Turnout | 7211 | 69.7 | |||
| Conservative hold | Swing | ||||
Castle Bromwich
| Party | Candidate | Votes | % | ±% | |
|---|---|---|---|---|---|
| Conservative | Gail Sleigh | 3,286 | 53.1 | ||
| Labour | Alan Jacques | 1407 | 22.7 | ||
| UKIP | Glen Lawrence | 1233 | 19.9 | ||
| Green | Eleanor Perfect | 264 | 4.3 | ||
| Majority | 1879 | 30.4 | |||
| Turnout | 6212 | 65.1 | |||
| Conservative hold | Swing | ||||
Chelmsley Wood
| Party | Candidate | Votes | % | ±% | |
|---|---|---|---|---|---|
| Green | Karl Macnaughton | 2,904 | 68.2 | ||
| Labour | Emma Chidler | 806 | 18.9 | ||
| Conservative | Sally Bell | 548 | 12.9 | ||
| Majority | 2098 | 49.3 | |||
| Turnout | 4296 | 50.3 | |||
| Green hold | Swing | ||||
Dorridge & Hockley Heath
| Party | Candidate | Votes | % | ±% | |
|---|---|---|---|---|---|
| Conservative | Andy Mackiewicz | 4,862 | 71.9 | ||
| Liberal Democrats | Paul Fairburn | 830 | 12.3 | ||
| Labour | Elizabeth Thacker | 572 | 8.5 | ||
| Green | Iona McIntyre | 495 | 7.3 | ||
| Majority | 4032 | 59.7 | |||
| Turnout | 6212 | 76.5 | |||
| Conservative hold | Swing | ||||
Elmdon
| Party | Candidate | Votes | % | ±% | |
|---|---|---|---|---|---|
| Conservative | Martin McCarthy | 2,035 | 31.4 | ||
| Green | Jean Hamilton | 1494 | 23.0 | ||
| Liberal Democrats | Jonathan Wharrad | 1191 | 18.4 | ||
| UKIP | John Bramham | 1107 | 17.1 | ||
| Labour | Marcus Brain | 655 | 10.1 | ||
| Majority | 541 | 8.3 | N/A | ||
| Turnout | 6500 | 67.7 | |||
| Conservative gain from Liberal Democrats | Swing | ||||
Kingshurst and Fordbridge
| Party | Candidate | Votes | % | ±% | |
|---|---|---|---|---|---|
| UKIP | Robert Hall | 1,548 | 35.6 | ||
| Labour | Alan Nash | 1332 | 30.6 | ||
| Conservative | Paul Thomas | 1176 | 27.0 | ||
| Green | David Davies | 293 | 6.7 | ||
| Majority | 216 | 5.0 | N/A | ||
| Turnout | 4362 | 48.0 | |||
| UKIP gain from Labour | Swing | ||||
Knowle
| Party | Candidate | Votes | % | ±% | |
|---|---|---|---|---|---|
| Conservative | Alan Rebeiro | 4,696 | 73.6 | ||
| Green | Michael Bleby | 926 | 14.5 | ||
| Labour | Simon Johnson | 758 | 11.9 | ||
| Majority | 3770 | 59.1 | |||
| Turnout | 6436 | 76.2 | |||
| Conservative hold | Swing | ||||
Lyndon
| Party | Candidate | Votes | % | ±% | |
|---|---|---|---|---|---|
| Conservative | Julie Hulland | 2,553 | 38.7 | ||
| Liberal Democrats | Adekunle Adeyemo | 2207 | 33.4 | ||
| Labour | Martin Tolman | 1302 | 19.7 | ||
| Green | Elaine Williams | 539 | 8.2 | ||
| Majority | 346 | 5.2 | N/A | ||
| Turnout | 6665 | 65.6 | |||
| Conservative gain from Liberal Democrats | Swing | ||||
Meriden
| Party | Candidate | Votes | % | ±% | |
|---|---|---|---|---|---|
| Conservative | David Bell | 4,591 | 63.9 | ||
| UKIP | Leslie Kaye | 1046 | 14.6 | ||
| Labour | Catherine Connan | 1019 | 14.2 | ||
| Green | Mark Pearson | 528 | 7.3 | ||
| Majority | 3545 | 49.3 | |||
| Turnout | 7205 | 73.6 | |||
| Conservative hold | Swing | ||||
Olton
| Party | Candidate | Votes | % | ±% | |
|---|---|---|---|---|---|
| Conservative | Robert Grinsell | 3,325 | 47.3 | ||
| Liberal Democrats | Priya Chauhan | 2314 | 32.9 | ||
| Labour | Martin Tolman | 830 | 11.8 | ||
| Green | Elaine Williams | 563 | 8.0 | ||
| Majority | 1011 | 14.4 | N/A | ||
| Turnout | 7092 | 71.5 | |||
| Conservative gain from Liberal Democrats | Swing | ||||
Shirley East
| Party | Candidate | Votes | % | ±% | |
|---|---|---|---|---|---|
| Conservative | Mark Parker | 3,323 | 53.1 | ||
| Liberal Democrats | Peter Lee | 1439 | 23.0 | ||
| Labour | Kevin Raven | 889 | 14.2 | ||
| Green | Eleanor Aldworth | 604 | 9.7 | ||
| Majority | 1884 | 30.1 | |||
| Turnout | 6307 | 70.1 | |||
| Conservative hold | Swing | ||||
Shirley South
| Party | Candidate | Votes | % | ±% | |
|---|---|---|---|---|---|
| Conservative | Angela Sandison | 2,850 | 41.1 | ||
| Green | Michelle Edinburgh | 1459 | 21.1 | ||
| Liberal Democrats | Martin Smith | 1086 | 15.7 | ||
| UKIP | Rosemary Worsley | 902 | 13.0 | ||
| Labour | Shirley Young | 634 | 9.1 | ||
| Majority | 1391 | 20.1 | |||
| Turnout | 6953 | 69.1 | |||
| Conservative hold | Swing | ||||
Shirley West
| Party | Candidate | Votes | % | ±% | |
|---|---|---|---|---|---|
| Conservative | Brian Holmes | 2,133 | 33.4 | ||
| Green | Margaret Allen | 1634 | 25.6 | ||
| Liberal Democrats | Eimear Fossey | 960 | 15.0 | ||
| UKIP | Rosemary Worsley | 933 | 14.6 | ||
| Labour | Raymond Brookes | 720 | 11.3 | ||
| Majority | 499 | 7.8 | |||
| Turnout | 6391 | 67.2 | |||
| Conservative hold | Swing | ||||
Silhill
| Party | Candidate | Votes | % | ±% | |
|---|---|---|---|---|---|
| Conservative | Robert Hulland | 3,893 | 58.0 | ||
| Liberal Democrats | Gaynor Mason | 1613 | 24.0 | ||
| Labour | Janet Marsh | 798 | 11.9 | ||
| Green | Trevor Barker | 407 | 6.1 | ||
| Majority | 2280 | 34.0 | |||
| Turnout | 6754 | 70.6 | |||
| Conservative hold | Swing | ||||
Smith's Wood
| Party | Candidate | Votes | % | ±% | |
|---|---|---|---|---|---|
| Green | Mark Wilson | 2,576 | 61.2 | ||
| Labour | David Cole | 1018 | 24.2 | ||
| Conservative | Graham Juniper | 613 | 14.6 | ||
| Majority | 1558 | 37.0 | |||
| Turnout | 4327 | 51.5 | |||
| Green hold | Swing | ||||
St Alphege
| Party | Candidate | Votes | % | ±% | |
|---|---|---|---|---|---|
| Conservative | Joe Tildesley | 5,531 | 68.8 | ||
| Liberal Democrats | Stuart Jameson | 1351 | 16.8 | ||
| Labour | Paul Tuxworth | 654 | 8.1 | ||
| Green | Margaret Ryan | 501 | 6.2 | ||
| Majority | 4180 | 52.0 | |||
| Turnout | 8086 | 75.5 | |||
| Conservative hold | Swing | ||||
References
- "Upcoming elections & referendums". The Electoral Commission. Archived from the original on 15 March 2015. Retrieved 23 March 2015.
- Solihull Council website
| Birmingham | |
|---|---|
| Coventry | |
| Dudley | |
| Sandwell | |
| Solihull | |
| Walsall | |
| Wolverhampton | |
| West Midlands County Council |
|
| Mayor | |
| |
This article is issued from Wikipedia. The text is licensed under Creative Commons - Attribution - Sharealike. Additional terms may apply for the media files.