1991 Colchester Borough Council election
Elections to Colchester Borough Council were held in May 1991. These were on the same day as other Local elections across England and Wales.
20 out of 60 seats to Colchester Borough Council 31 seats needed for a majority | |||||||||||||||||||||||||||||||||||||||||||||||||||||||||||
|---|---|---|---|---|---|---|---|---|---|---|---|---|---|---|---|---|---|---|---|---|---|---|---|---|---|---|---|---|---|---|---|---|---|---|---|---|---|---|---|---|---|---|---|---|---|---|---|---|---|---|---|---|---|---|---|---|---|---|---|
| Turnout | 43.5% ( | ||||||||||||||||||||||||||||||||||||||||||||||||||||||||||
| |||||||||||||||||||||||||||||||||||||||||||||||||||||||||||
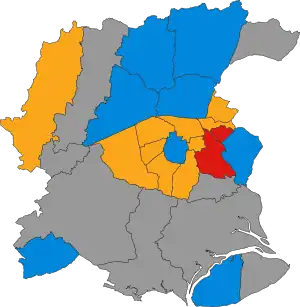 Winner of each seat at the 1991 Colchester Borough Council election | |||||||||||||||||||||||||||||||||||||||||||||||||||||||||||
| |||||||||||||||||||||||||||||||||||||||||||||||||||||||||||
Summary
| 1991 Colchester Borough Council election | ||||||||||
|---|---|---|---|---|---|---|---|---|---|---|
| Party | This election | Full council | This election | |||||||
| Seats | Net | Seats % | Other | Total | Total % | Votes | Votes % | +/− | ||
| Liberal Democrats | 10 | 50.0 | 18 | 28 | 46.7 | 17,518 | 39.9 | +4.5 | ||
| Conservative | 8 | 40.0 | 11 | 19 | 31.7 | 15,351 | 35.0 | +4.2 | ||
| Labour | 2 | 10.0 | 9 | 11 | 18.3 | 8,952 | 20.4 | –8.7 | ||
| Tiptree Residents | 0 | 0.0 | 2 | 2 | 3.3 | 740 | 1.7 | –0.7 | ||
| Green | 0 | 0.0 | 0 | 0 | 0.0 | 953 | 2.2 | +1.1 | ||
| Independent | 0 | 0.0 | 0 | 0 | 0.0 | 335 | 0.8 | +0.2 | ||
Ward results
Berechurch
| Party | Candidate | Votes | % | ±% | |
|---|---|---|---|---|---|
| Liberal Democrats | Terry Sutton* | 1,354 | 54.7 | +5.9 | |
| Labour | Dave Harris | 666 | 26.9 | -10.0 | |
| Conservative | S. Rowley | 391 | 15.8 | +1.5 | |
| Green | Mary Richardson | 63 | 2.5 | N/A | |
| Majority | 688 | 27.8 | N/A | ||
| Turnout | 2,474 | 43.0 | -8.3 | ||
| Registered electors | 5,805 | ||||
| Liberal Democrats hold | Swing | ||||
Boxted & Langham
| Party | Candidate | Votes | % | ±% | |
|---|---|---|---|---|---|
| Conservative | J. Garnett* | 665 | 65.3 | +5.4 | |
| Liberal Democrats | W. Chivers | 354 | 34.7 | +8.3 | |
| Majority | 311 | 30.6 | -3.3 | ||
| Turnout | 665 | 56.0 | +0.9 | ||
| Registered electors | 1,826 | ||||
| Conservative hold | Swing | ||||
No Labour candidate as previous (13.7%).
Castle
| Party | Candidate | Votes | % | ±% | |
|---|---|---|---|---|---|
| Liberal Democrats | J. Carter* | 1,234 | 49.8 | +9.5 | |
| Labour | J. Cant | 583 | 23.5 | -9.1 | |
| Conservative | G. Haigh-Thomas | 561 | 22.6 | -0.5 | |
| Green | S. Newton | 101 | 4.1 | -0.1 | |
| Majority | 651 | 26.3 | N/A | ||
| Turnout | 2,479 | 46.0 | -5.5 | ||
| Registered electors | 5,343 | ||||
| Liberal Democrats hold | Swing | ||||
Great & Little Horkesley
| Party | Candidate | Votes | % | ±% | |
|---|---|---|---|---|---|
| Conservative | E. Paice* | 560 | 60.2 | ±0.0 | |
| Liberal Democrats | Ronald Baker | 215 | 23.1 | +6.5 | |
| Labour | Maureen Lee | 155 | 16.7 | +0.1 | |
| Majority | 345 | 37.1 | +10.2 | ||
| Turnout | 930 | 52.0 | +0.4 | ||
| Registered electors | 1,795 | ||||
| Conservative hold | Swing | ||||
Great Tey
| Party | Candidate | Votes | % | ±% | |
|---|---|---|---|---|---|
| Liberal Democrats | J. Brice* | 719 | 68.0 | +13.7 | |
| Conservative | I. Stratford | 339 | 32.0 | -4.0 | |
| Majority | 380 | 35.9 | +17.6 | ||
| Turnout | 1,058 | 61.0 | +4.6 | ||
| Registered electors | 1,727 | ||||
| Liberal Democrats hold | Swing | ||||
Harbour
| Party | Candidate | Votes | % | ±% | |
|---|---|---|---|---|---|
| Labour | Rod Green* | 1,017 | 43.4 | -1.0 | |
| Liberal Democrats | Patricia Blandon | 873 | 37.2 | -4.2 | |
| Conservative | Mike Coyne | 391 | 16.7 | +9.6 | |
| Green | D. Ross | 52 | 2.2 | N/A | |
| Independent | D. Smith | 11 | 0.5 | N/A | |
| Majority | 144 | 6.1 | N/A | ||
| Turnout | 2,344 | 42.0 | -0.5 | ||
| Registered electors | 5,721 | ||||
| Labour hold | Swing | ||||
Lexden
| Party | Candidate | Votes | % | ±% | |
|---|---|---|---|---|---|
| Liberal Democrats | Barbara Williamson* | 1,167 | 47.8 | -5.4 | |
| Conservative | Sonia Lewis | 1,131 | 46.3 | +5.9 | |
| Labour | D. Francis | 100 | 4.1 | -2.2 | |
| Green | D. Smith | 45 | 1.8 | N/A | |
| Majority | 36 | 1.5 | N/A | ||
| Turnout | 2,443 | 57.0 | +0.6 | ||
| Registered electors | 4,351 | ||||
| Liberal Democrats hold | Swing | ||||
Mile End
| Party | Candidate | Votes | % | ±% | |
|---|---|---|---|---|---|
| Conservative | D. Fulford* | 1,380 | 48.7 | -1.4 | |
| Liberal Democrats | B. Trusler | 895 | 31.6 | +19.2 | |
| Labour | J. Evans | 468 | 16.5 | -19.9 | |
| Green | Peter Ward | 89 | 3.1 | N/A | |
| Majority | 485 | 17.1 | N/A | ||
| Turnout | 2,832 | 43.0 | +2.0 | ||
| Registered electors | 6,735 | ||||
| Conservative hold | Swing | ||||
New Town
| Party | Candidate | Votes | % | ±% | |
|---|---|---|---|---|---|
| Liberal Democrats | S. Haylock* | 1,391 | 62.6 | +2.7 | |
| Labour | Dave Speed | 518 | 23.3 | -10.0 | |
| Conservative | N. Elcombe | 211 | 9.5 | +5.0 | |
| Green | K. Smallwood | 101 | 4.5 | N/A | |
| Majority | 873 | 39.3 | N/A | ||
| Turnout | 2,221 | 43.0 | -4.7 | ||
| Registered electors | 5,217 | ||||
| Liberal Democrats hold | Swing | ||||
Prettygate
| Party | Candidate | Votes | % | ±% | |
|---|---|---|---|---|---|
| Liberal Democrats | Paul Sheppard | 1,399 | 44.7 | -13.2 | |
| Conservative | H. Shutter | 1,274 | 40.7 | +5.4 | |
| Labour | T. Pearson | 379 | 12.1 | +5.2 | |
| Green | J. Havelock | 81 | 2.6 | N/A | |
| Majority | 125 | 4.0 | N/A | ||
| Turnout | 3,133 | 54.0 | +1.8 | ||
| Registered electors | 5,810 | ||||
| Liberal Democrats hold | Swing | ||||
Shrub End
| Party | Candidate | Votes | % | ±% | |
|---|---|---|---|---|---|
| Liberal Democrats | K. Starling* | 867 | 53.6 | -6.6 | |
| Labour | Frank Wilkin | 397 | 24.6 | -8.1 | |
| Conservative | S. Willson | 316 | 19.5 | +12.5 | |
| Green | Walter Schwartz | 37 | 2.3 | N/A | |
| Majority | 470 | 28.0 | N/A | ||
| Turnout | 1,617 | 29.1 | -1.3 | ||
| Registered electors | 5,831 | ||||
| Liberal Democrats hold | Swing | ||||
St. Andrew's
| Party | Candidate | Votes | % | ±% | |
|---|---|---|---|---|---|
| Labour | P. Truscott* | 861 | 54.2 | -17.1 | |
| Liberal Democrats | J. Gamble | 338 | 21.3 | +13.4 | |
| Conservative | N. Taylor | 316 | 19.9 | +5.9 | |
| Green | Mohammed Shabbeer | 73 | 4.6 | -2.2 | |
| Majority | 523 | 32.9 | N/A | ||
| Turnout | 1,588 | 26.0 | -4.2 | ||
| Registered electors | 6,039 | ||||
| Labour hold | Swing | ||||
St. Anne's
| Party | Candidate | Votes | % | ±% | |
|---|---|---|---|---|---|
| Liberal Democrats | Mike Hogg* | 1,311 | 51.9 | +9.6 | |
| Labour | Tim Young | 879 | 34.8 | -10.2 | |
| Conservative | E. Hamilton | 292 | 11.6 | -1.1 | |
| Green | B. Smith | 42 | 1.7 | N/A | |
| Majority | 432 | 17.1 | N/A | ||
| Turnout | 2,524 | 43.0 | -1.4 | ||
| Registered electors | 5,872 | ||||
| Liberal Democrats hold | Swing | ||||
St. John's
| Party | Candidate | Votes | % | ±% | |
|---|---|---|---|---|---|
| Liberal Democrats | P. Hiller* | 1,598 | 52.7 | -0.5 | |
| Conservative | D. McBean | 1,122 | 37.0 | +1.3 | |
| Labour | M. Scott | 270 | 8.9 | -1.2 | |
| Green | N. Shabbeer | 40 | 1.3 | N/A | |
| Majority | 476 | 15.7 | N/A | ||
| Turnout | 3,030 | 52.0 | +1.1 | ||
| Registered electors | 5,778 | ||||
| Liberal Democrats hold | Swing | ||||
St. Mary's
| Party | Candidate | Votes | % | ±% | |
|---|---|---|---|---|---|
| Conservative | H. Pawsey* | 963 | 42.1 | -4.7 | |
| Liberal Democrats | H. Chamberlain | 871 | 38.1 | +29.1 | |
| Labour | R. Turp | 365 | 16.0 | -21.4 | |
| Green | K. Monteith | 87 | 3.8 | N/A | |
| Majority | 92 | 4.0 | N/A | ||
| Turnout | 2,286 | 44.0 | +1.5 | ||
| Registered electors | 5,151 | ||||
| Conservative hold | Swing | ||||
Stanway
| Party | Candidate | Votes | % | ±% | |
|---|---|---|---|---|---|
| Liberal Democrats | K. Davis* | 1,367 | 53.4 | -0.5 | |
| Conservative | J. Orpen-Smellie | 859 | 33.5 | +3.6 | |
| Labour | R. Turp | 365 | 16.0 | -0.4 | |
| Independent | E. Curtis-Oram | 47 | 1.8 | N/A | |
| Majority | 508 | 19.8 | N/A | ||
| Turnout | 2,638 | 45.0 | -4.6 | ||
| Registered electors | 5,694 | ||||
| Liberal Democrats hold | Swing | ||||
Tiptree
| Party | Candidate | Votes | % | ±% | |
|---|---|---|---|---|---|
| Conservative | B. Martin | 1,092 | 46.1 | +33.1 | |
| Tiptree Residents | John Elliott* | 740 | 31.7 | -14.7 | |
| Labour | A. Axtrill | 516 | 22.1 | -7.3 | |
| Majority | 352 | 14.4 | N/A | ||
| Turnout | 2,348 | 39.0 | +1.8 | ||
| Registered electors | 6,069 | ||||
| Conservative gain from Tiptree Residents | Swing | ||||
West Bergholt & Eight Ash Green
| Party | Candidate | Votes | % | ±% | |
|---|---|---|---|---|---|
| Conservative | J. Lampon* | 910 | 47.6 | -10.4 | |
| Liberal Democrats | K. Free | 809 | 42.4 | +0.4 | |
| Labour | Julie Young | 191 | 10.0 | N/A | |
| Majority | 101 | 5.3 | N/A | ||
| Turnout | 1,910 | 52.0 | +14.3 | ||
| Registered electors | 3,664 | ||||
| Conservative hold | Swing | ||||
West Mersea
| Party | Candidate | Votes | % | ±% | |
|---|---|---|---|---|---|
| Conservative | John Bouckley* | 1,486 | 64.0 | -14.7 | |
| Liberal Democrats | M. Livermore | 337 | 14.5 | +3.8 | |
| Independent | P. French | 277 | 11.9 | N/A | |
| Labour | G. Newman | 222 | 9.6 | -1.0 | |
| Majority | 1,149 | 49.5 | N/A | ||
| Turnout | 2,322 | 43.0 | +7.1 | ||
| Registered electors | 5,465 | ||||
| Conservative hold | Swing | ||||
Wivenhoe
| Party | Candidate | Votes | % | ±% | |
|---|---|---|---|---|---|
| Conservative | David Adams* | 1,092 | 41.1 | +5.8 | |
| Labour | Robert Newman | 1,001 | 37.7 | -18.1 | |
| Liberal Democrats | I. O'Mahoney | 419 | 15.8 | N/A | |
| Green | M. Paterson | 142 | 5.4 | -3.5 | |
| Majority | 91 | 3.4 | N/A | ||
| Turnout | 2,654 | 44.0 | -1.4 | ||
| Registered electors | 6,060 | ||||
| Conservative gain from Labour | Swing | ||||
References
| Metropolitan boroughs |
|
|---|---|
| District councils (England) |
|
| District councils (Wales) |
|
This article is issued from Wikipedia. The text is licensed under Creative Commons - Attribution - Sharealike. Additional terms may apply for the media files.