1976 Colchester Borough Council election
Elections to Colchester Borough Council were held in 1976 alongside other local elections across the country. The whole council was up for election on new ward boundaries.
All 60 seats to Colchester Borough Council 31 seats needed for a majority | |||||||||||||||||||||||||||||||||||||||||||||||
|---|---|---|---|---|---|---|---|---|---|---|---|---|---|---|---|---|---|---|---|---|---|---|---|---|---|---|---|---|---|---|---|---|---|---|---|---|---|---|---|---|---|---|---|---|---|---|---|
| |||||||||||||||||||||||||||||||||||||||||||||||
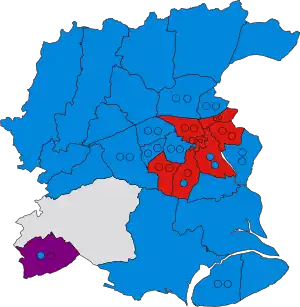 Winner of each seat at the 1976 Colchester Borough Council election | |||||||||||||||||||||||||||||||||||||||||||||||
| |||||||||||||||||||||||||||||||||||||||||||||||
Results summary
| Party | Seats | Gains | Losses | Net gain/loss | Seats % | Votes % | Votes | +/− | |
|---|---|---|---|---|---|---|---|---|---|
| Conservative | 39 | 5 | 1 | 65.0 | 55.9 | 51,152 | +12.8 | ||
| Labour | 18 | 0 | 3 | 30.0 | 31.7 | 29,001 | -12.7 | ||
| Tiptree Residents | 2 | 0 | 0 | 3.3 | 3.1 | 2,855 | +2.4 | ||
| Independent | 1 | 1 | 2 | 1.7 | 1.5 | 1,339 | -3.9 | ||
| Liberal | 0 | 0 | 0 | 0.0 | 7.9 | 7,199 | +1.5 | ||
Ward results
Berechurch
| Party | Candidate | Votes | % | ||
|---|---|---|---|---|---|
| Labour | W. Ladbrook | 770 | 37.2 | ||
| Labour | C. Howe | 769 | 37.1 | ||
| Conservative | L. Long | 742 | 35.8 | ||
| Labour | R. McQuitty | 741 | 35.8 | ||
| Conservative | V. Worth | 675 | 32.6 | ||
| Conservative | Nigel Chapman | 642 | 31.0 | ||
| Liberal | M. Gage | 611 | 29.5 | ||
| Liberal | T. Davis | 389 | 18.8 | ||
| Turnout | 2,070 | 38.1 | |||
| Registered electors | 5,432 | ||||
| Labour win (new seat) | |||||
| Labour win (new seat) | |||||
| Conservative win (new seat) | |||||
Birch-Messing
| Party | Candidate | Votes | % | ±% | |
|---|---|---|---|---|---|
| Independent | T. Wayman | 546 | 70.0 | N/A | |
| Conservative | J. Crowe | 234 | 30.0 | -11.9 | |
| Majority | 312 | 40.0 | N/A | ||
| Turnout | 780 | 61.6 | -9.2 | ||
| Registered electors | 1,267 | ||||
| Independent gain from Conservative | Swing | N/A | |||
Boxted & Langham
| Party | Candidate | Votes | % | ±% | |
|---|---|---|---|---|---|
| Conservative | A. Sexton | 699 | 85.2 | +14.0 | |
| Labour | T. Morecroft | 121 | 14.8 | +0.2 | |
| Majority | 576 | 70.4 | +13.8 | ||
| Turnout | 820 | 51.7 | +4.4 | ||
| Registered electors | 1,586 | ||||
| Conservative hold | Swing | ||||
Castle
| Party | Candidate | Votes | % | ||
|---|---|---|---|---|---|
| Labour | S. Wills | 1,122 | 47.5 | ||
| Labour | J. Dunn | 1,048 | 44.4 | ||
| Labour | Ken Cooke | 1,025 | 43.4 | ||
| Conservative | D. Lamberth | 1,023 | 43.3 | ||
| Conservative | K. Wheeler | 995 | 42.1 | ||
| Conservative | K. Wilson | 969 | 41.0 | ||
| Liberal | O. Reeves | 196 | 8.3 | ||
| Liberal | D. Marshall | 185 | 7.8 | ||
| Liberal | P. Mills | 184 | 7.8 | ||
| Turnout | 2,361 | 49.2 | |||
| Registered electors | 4,799 | ||||
| Labour win (new seat) | |||||
| Labour win (new seat) | |||||
| Labour win (new seat) | |||||
Copford & Eight Ash Green
| Party | Candidate | Votes | % | ±% | |
|---|---|---|---|---|---|
| Conservative | M. Wilde | 610 | 76.6 | +14.4 | |
| Labour | D. Clark | 186 | 23.4 | +5.7 | |
| Majority | 424 | 53.2 | +8.7 | ||
| Turnout | 796 | 47.6 | +8.0 | ||
| Registered electors | 1,554 | ||||
| Conservative hold | Swing | ||||
Dedham
| Party | Candidate | Votes | % | ±% | |
|---|---|---|---|---|---|
| Conservative | J. Jackson | 474 | 67.0 | +14.7 | |
| Independent | G. Curtis | 233 | 33.0 | N/A | |
| Majority | 241 | 34.0 | +8.6 | ||
| Turnout | 707 | 52.3 | -6.2 | ||
| Registered electors | 1,355 | ||||
| Conservative hold | Swing | N/A | |||
East Donyland
| Party | Candidate | Votes | % | ±% | |
|---|---|---|---|---|---|
| Conservative | J. Sanderson | 482 | 57.6 | +7.3 | |
| Labour | E. Lilley | 355 | 42.4 | -7.3 | |
| Majority | 127 | 15.2 | +14.6 | ||
| Turnout | 837 | 67.3 | +10.7 | ||
| Registered electors | 1,245 | ||||
| Conservative hold | Swing | ||||
Fordham
| Party | Candidate | Votes | % | ±% | |
|---|---|---|---|---|---|
| Conservative | G. Penrose | 448 | 55.2 | +17.6 | |
| Liberal | G. Williams | 363 | 44.8 | N/A | |
| Majority | 85 | 10.4 | N/A | ||
| Turnout | 811 | 63.8 | +9.7 | ||
| Registered electors | 1,275 | ||||
| Conservative gain from Independent | Swing | N/A | |||
Great & Little Horkesley
| Party | Candidate | Votes | % | ±% | |
|---|---|---|---|---|---|
| Conservative | W. Knighton | Unopposed | |||
| Registered electors | 1,554 | ||||
| Conservative win (new seat) | |||||
Great Tey
| Party | Candidate | Votes | % | ±% | |
|---|---|---|---|---|---|
| Conservative | R. Browning | Unopposed | |||
| Registered electors | 1,341 | ||||
| Conservative hold | |||||
Harbour
| Party | Candidate | Votes | % | ||
|---|---|---|---|---|---|
| Labour | J. Bird | 989 | 44.7 | ||
| Conservative | M. Coyne | 915 | 41.3 | ||
| Conservative | E. White | 877 | 39.6 | ||
| Labour | C. Parmenter | 839 | 37.9 | ||
| Labour | A. Blishen | 834 | 37.7 | ||
| Conservative | K. White | 827 | 37.4 | ||
| Liberal | D. Wisbey | 263 | 11.9 | ||
| Liberal | N. Wake | 261 | 11.8 | ||
| Turnout | 2,213 | 45.9 | |||
| Registered electors | 4,822 | ||||
| Labour win (new seat) | |||||
| Conservative win (new seat) | |||||
| Conservative win (new seat) | |||||
Lexden
| Party | Candidate | Votes | % | ||
|---|---|---|---|---|---|
| Conservative | J. Wheeler | 1,403 | 62.9 | ||
| Conservative | C. Sargeant | 1,402 | 62.9 | ||
| Conservative | D. Holt | 1,375 | 61.7 | ||
| Liberal | M. Fisher | 506 | 22.7 | ||
| Liberal | C. Cole | 441 | 19.8 | ||
| Liberal | Ian Trusler | 437 | 19.6 | ||
| Labour | J. Coombes | 362 | 16.2 | ||
| Turnout | 2,229 | 58.3 | |||
| Registered electors | 3,824 | ||||
| Conservative win (new seat) | |||||
| Conservative win (new seat) | |||||
| Conservative win (new seat) | |||||
Marks Tey
| Party | Candidate | Votes | % | ±% | |
|---|---|---|---|---|---|
| Conservative | E. James | 566 | 78.2 | +9.7 | |
| Labour | Jim Orpe | 158 | 21.8 | -9.7 | |
| Majority | 408 | 56.4 | N/A | ||
| Turnout | 724 | 47.7 | -5.8 | ||
| Registered electors | 1,525 | ||||
| Conservative hold | Swing | ||||
Mile End
| Party | Candidate | Votes | % | ±% | |
|---|---|---|---|---|---|
| Conservative | D. Blackmore | 1,119 | 69.6 | ||
| Conservative | D. Fulford | 1,087 | |||
| Conservative | J. Fulford | 1,084 | |||
| Labour | P. Baker | 489 | 30.4 | ||
| Majority | 39.2 | ||||
| Turnout | 47.2 | ||||
| Conservative win (new seat) | |||||
| Conservative win (new seat) | |||||
| Conservative win (new seat) | |||||
New Town
| Party | Candidate | Votes | % | ||
|---|---|---|---|---|---|
| Labour | Bob Russell | 1,284 | 56.6 | ||
| Labour | D. Williams | 1,191 | 52.5 | ||
| Labour | J. Bensusan-Butt | 1,078 | 47.5 | ||
| Conservative | E. Chapman | 640 | 28.2 | ||
| Conservative | C. Willburn | 606 | 26.7 | ||
| Conservative | M. Harvey | 541 | 23.9 | ||
| Liberal | T. Brady | 525 | 23.1 | ||
| Liberal | A. Grant | 408 | 18.0 | ||
| Liberal | M. Pawsey | 373 | 16.4 | ||
| Turnout | 2,268 | 48.7 | |||
| Registered electors | 4,656 | ||||
| Labour win (new seat) | |||||
| Labour win (new seat) | |||||
| Labour win (new seat) | |||||
Prettygate
| Party | Candidate | Votes | % | ||
|---|---|---|---|---|---|
| Conservative | E. Kent | 1,378 | 61.1 | ||
| Conservative | F. Clater | 1,362 | 60.4 | ||
| Conservative | D. Purvis | 1,356 | 60.1 | ||
| Labour | R. Read | 664 | 29.4 | ||
| Labour | B. Sawyer | 588 | 26.1 | ||
| Labour | P. Perera | 545 | 24.2 | ||
| Liberal | J. Smith | 415 | 18.4 | ||
| Turnout | 2,255 | 47.0 | |||
| Registered electors | 4,798 | ||||
| Conservative win (new seat) | |||||
| Conservative win (new seat) | |||||
| Conservative win (new seat) | |||||
Pyefleet
| Party | Candidate | Votes | % | ±% | |
|---|---|---|---|---|---|
| Conservative | A. Parsonson | 562 | 75.0 | +4.5 | |
| Labour | J. Jopling | 187 | 25.0 | -4.5 | |
| Majority | 375 | 50.0 | +9.0 | ||
| Turnout | 749 | 61.2 | +24.6 | ||
| Registered electors | 1,231 | ||||
| Conservative hold | Swing | ||||
Shrub End
| Party | Candidate | Votes | % | ||
|---|---|---|---|---|---|
| Labour | L. Woodrow | 939 | 41.6 | ||
| Labour | Frank Wilkin | 881 | 39.1 | ||
| Labour | E. Plowright | 866 | 38.4 | ||
| Conservative | I. Davis | 547 | 24.3 | ||
| Conservative | C. Barritt | 515 | 22.8 | ||
| Conservative | C. Crossley | 498 | 22.1 | ||
| Turnout | 2,255 | 47.3 | |||
| Registered electors | 4,760 | ||||
| Labour win (new seat) | |||||
| Labour win (new seat) | |||||
| Labour win (new seat) | |||||
St. Andrew's
| Party | Candidate | Votes | % | ||
|---|---|---|---|---|---|
| Labour | A. Leighton | 1,345 | 77.3 | ||
| Labour | D. Braddy | 1,116 | 64.1 | ||
| Labour | Graham Bober | 1,068 | 61.3 | ||
| Conservative | J. Duke | 516 | 29.6 | ||
| Conservative | V. Watts | 476 | 27.3 | ||
| Conservative | G. Stubbs | 470 | 27.0 | ||
| Turnout | 1,741 | 31.9 | |||
| Registered electors | 5,456 | ||||
| Labour win (new seat) | |||||
| Labour win (new seat) | |||||
| Labour win (new seat) | |||||
St. Anne's
| Party | Candidate | Votes | % | ||
|---|---|---|---|---|---|
| Labour | Mary Frank | 771 | 50.6 | ||
| Labour | J. Fraser | 753 | 49.4 | ||
| Labour | G. Cooper | 717 | 47.0 | ||
| Conservative | W. Falk | 636 | 41.7 | ||
| Conservative | A. Dunlop | 635 | 41.7 | ||
| Conservative | A. Richardson | 629 | 41.3 | ||
| Turnout | 1,524 | 38.1 | |||
| Registered electors | 4,001 | ||||
| Labour win (new seat) | |||||
| Labour win (new seat) | |||||
| Labour win (new seat) | |||||
St. John's
| Party | Candidate | Votes | % | ||
|---|---|---|---|---|---|
| Conservative | C. Diggens | 1,112 | 68.5 | ||
| Conservative | B. West | 1,041 | 64.1 | ||
| Conservative | M. Pinnock | 1,031 | 63.5 | ||
| Labour | P. Treacher | 522 | 32.1 | ||
| Turnout | 1,624 | 49.1 | |||
| Registered electors | 3,308 | ||||
| Conservative win (new seat) | |||||
| Conservative win (new seat) | |||||
| Conservative win (new seat) | |||||
St. Mary's
| Party | Candidate | Votes | % | ||
|---|---|---|---|---|---|
| Conservative | J. Brooks | 1,582 | 62.5 | ||
| Conservative | R. Spendlove | 1,348 | 53.2 | ||
| Conservative | R. Hilham | 1,264 | 49.9 | ||
| Labour | Tim Oxton | 564 | 22.3 | ||
| Liberal | Martin Hunt | 536 | 21.2 | ||
| Liberal | A. Spyvee | 534 | 21.1 | ||
| Liberal | L. Baker | 508 | 20.1 | ||
| Turnout | 2,532 | 50.8 | |||
| Registered electors | 4,985 | ||||
| Conservative win (new seat) | |||||
| Conservative win (new seat) | |||||
| Conservative win (new seat) | |||||
Stanway
| Party | Candidate | Votes | % | ||
|---|---|---|---|---|---|
| Conservative | T. Claydon | 1,008 | 53.7 | ||
| Conservative | P. Holloway | 993 | 52.9 | ||
| Conservative | D. Arrondelle | 964 | 51.4 | ||
| Labour | E. Kirkby | 797 | 42.5 | ||
| Labour | J. Knight | 772 | 41.2 | ||
| Labour | K. Rodgers | 652 | 34.8 | ||
| Turnout | 1,876 | 52.2 | |||
| Registered electors | 3,593 | ||||
| Conservative gain from Labour | |||||
| Conservative gain from Labour | |||||
| Conservative win (new seat) | |||||
Tiptree
| Party | Candidate | Votes | % | ||
|---|---|---|---|---|---|
| Tiptree Residents | A. Garrod | 1,006 | 41.1 | ||
| Conservative | C. Cansdale | 1,005 | 41.0 | ||
| Tiptree Residents | J. Webb | 966 | 39.4 | ||
| Tiptree Residents | D. Burke | 883 | 36.1 | ||
| Conservative | R. Martin | 869 | 35.5 | ||
| Conservative | J. Lawrence | 743 | 30.3 | ||
| Labour | B. Jones | 566 | 23.1 | ||
| Turnout | 2,449 | 46.9 | |||
| Registered electors | 5,221 | ||||
| Tiptree Residents win (new seat) | |||||
| Conservative win (new seat) | |||||
| Tiptree Residents win (new seat) | |||||
West Bergholt
| Party | Candidate | Votes | % | ±% | |
|---|---|---|---|---|---|
| Conservative | J. Lampon | 662 | 81.5 | +15.0 | |
| Labour | T. Fleet | 86 | 10.6 | -9.9 | |
| Liberal | M. Livermore | 64 | 7.9 | N/A | |
| Majority | 576 | 70.9 | +24.8 | ||
| Turnout | 812 | 47.4 | +2.0 | ||
| Registered electors | 1,721 | ||||
| Conservative hold | Swing | ||||
West Mersea
| Party | Candidate | Votes | % | ||
|---|---|---|---|---|---|
| Conservative | A. Gray | 1,439 | 76.6 | ||
| Conservative | J. Williams | 1,285 | 68.4 | ||
| Conservative | G. Roberts | 1,238 | 65.9 | ||
| Independent | A. Smith | 518 | 27.6 | ||
| Labour | C. Barrett | 202 | 10.8 | ||
| Turnout | 1,879 | 46.7 | |||
| Registered electors | 4,024 | ||||
| Conservative hold | |||||
| Conservative gain from Independent | |||||
| Conservative hold | |||||
Winstree
| Party | Candidate | Votes | % | ±% | |
|---|---|---|---|---|---|
| Conservative | M. Fairhead | 823 | 72.8 | +12.4 | |
| Labour | S. McAndrew | 266 | 23.5 | -0.6 | |
| Independent | W. Judge | 42 | 3.7 | N/A | |
| Majority | 557 | 49.3 | +13.1 | ||
| Turnout | 1,131 | 60.6 | -6.5 | ||
| Registered electors | 1,875 | ||||
| Conservative hold | Swing | ||||
Wivenhoe
| Party | Candidate | Votes | % | ||
|---|---|---|---|---|---|
| Conservative | D. Wilkinson | 1,009 | 51.6 | ||
| Conservative | B. Grasby | 905 | 46.3 | ||
| Conservative | K. Brereton | 816 | 41.7 | ||
| Labour | G. Davies | 773 | 39.5 | ||
| Turnout | 1,956 | 42.9 | |||
| Registered electors | 4,560 | ||||
| Conservative hold | |||||
| Conservative hold | |||||
| Conservative gain from Labour | |||||
References
| Metropolitan boroughs |
|
|---|---|
| District councils (England) |
|
| District councils (Wales) |
|
This article is issued from Wikipedia. The text is licensed under Creative Commons - Attribution - Sharealike. Additional terms may apply for the media files.