1983 Harlow District Council election
The 1983 Harlow District Council election took place on 5 May 1983 to elect members of Harlow District Council in Essex, England. This was on the same day as other local elections. The Labour Party retained control of the council.
| |||||||||||||||||||||||||||||||||||||
14 of the 42 seats to Harlow District Council 22 seats needed for a majority | |||||||||||||||||||||||||||||||||||||
|---|---|---|---|---|---|---|---|---|---|---|---|---|---|---|---|---|---|---|---|---|---|---|---|---|---|---|---|---|---|---|---|---|---|---|---|---|---|
| |||||||||||||||||||||||||||||||||||||
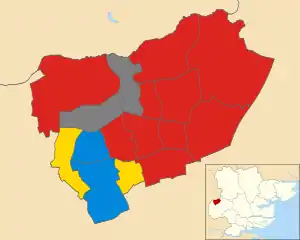 Map showing the results of contested wards in the 1983 Harlow District Council elections. | |||||||||||||||||||||||||||||||||||||
| |||||||||||||||||||||||||||||||||||||
Election result
| Party | Seats | Gains | Losses | Net gain/loss | Seats % | Votes % | Votes | +/− | |
|---|---|---|---|---|---|---|---|---|---|
| Labour | 10 | 1 | 0 | 71.4 | 47.4 | 11,880 | |||
| Alliance | 2 | 1 | 0 | 14.3 | 29.4 | 7,383 | |||
| Conservative | 2 | 0 | 2 | 14.3 | 23.2 | 5,824 | |||
All comparisons in vote share are to the corresponding 1979 election.
Ward results
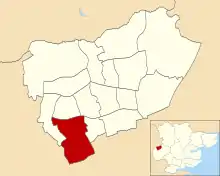
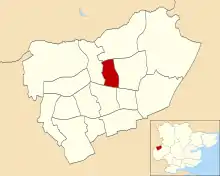
Brays Grove
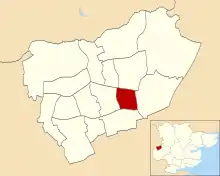
Location of Brays Grove ward
| Party | Candidate | Votes | % | |
|---|---|---|---|---|
| Labour | M. Juliff | 829 | 55.2% | |
| Alliance | H. Wilcox | 443 | 29.5% | |
| Conservative | T. McArdle | 230 | 15.3% | |
| Turnout | 45.1% | |||
| Labour hold | ||||
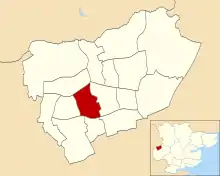
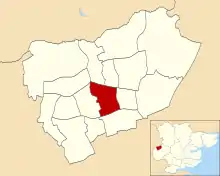
Great Parndon
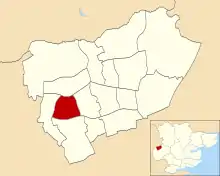
Location of Great Parndon ward
| Party | Candidate | Votes | % | |
|---|---|---|---|---|
| Conservative | G. Mitchinson | 888 | 47.8% | |
| Labour | R. Didham | 668 | 36.0% | |
| Alliance | B. Manktelow | 301 | 16.2% | |
| Turnout | 53.5% | |||
| Conservative hold | ||||
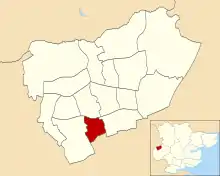
Katherines With Sumner
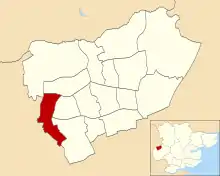
Location of Katherines with Sumner ward
| Party | Candidate | Votes | % | |
|---|---|---|---|---|
| Alliance | P. Martin | 859 | 43.2% | |
| Labour | A. Evans | 745 | 37.5% | |
| Conservative | P. McLaron | 383 | 19.3% | |
| Turnout | 46.4% | |||
| Alliance gain from Conservative | ||||
Kingsmoor
Location of Kingsmoor ward
| Party | Candidate | Votes | % | |
|---|---|---|---|---|
| Conservative | F. Burgoyne | 900 | 41.1% | |
| Labour | J. Young | 836 | 38.2% | |
| Alliance | N. Huggins | 454 | 20.7% | |
| Turnout | 47.0% | |||
| Conservative hold | ||||
Latton Bush
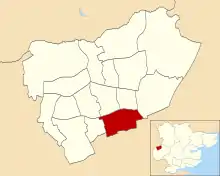
Location of Latton Bush ward
| Party | Candidate | Votes | % | |
|---|---|---|---|---|
| Labour | P. Bruce | 1,056 | 56.8% | |
| Conservative | N. Clapham | 463 | 24.9% | |
| Alliance | S. James | 341 | 18.3% | |
| Turnout | 43.8% | |||
| Labour hold | ||||
Little Parndon
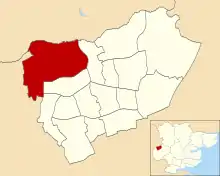
Location of Little Parndon ward
| Party | Candidate | Votes | % | |
|---|---|---|---|---|
| Labour | S. Warner | 990 | 59.2% | |
| Alliance | P. McLintic | 343 | 20.5% | |
| Conservative | E. Atkins | 339 | 20.3% | |
| Turnout | 40.5% | |||
| Labour hold | ||||
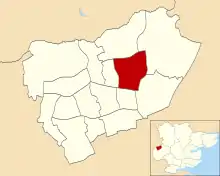
Mark Hall North

Location of Mark Hall North ward
| Party | Candidate | Votes | % | |
|---|---|---|---|---|
| Labour | J. McAlpine | 629 | 48.0% | |
| Conservative | P. Mould | 342 | 26.1% | |
| Alliance | N. Armitage | 339 | 25.9% | |
| Turnout | 55.2% | |||
| Labour hold | ||||
Mark Hall South
Location of Mark Hall South ward
| Party | Candidate | Votes | % | |
|---|---|---|---|---|
| Labour | L. Smith | 994 | 54.6% | |
| Alliance | C. Brown | 515 | 28.3% | |
| Conservative | S. Tucker | 312 | 17.1% | |
| Turnout | 44.5% | |||
| Labour hold | ||||
Netteswell East
Location of Netteswell East ward
| Party | Candidate | Votes | % | |
|---|---|---|---|---|
| Labour | A. Garner | 732 | 52.0% | |
| Alliance | R. Freeman | 379 | 26.9% | |
| Conservative | R. Dixon | 296 | 21.0% | |
| Turnout | 47.0% | |||
| Labour hold | ||||
Old Harlow
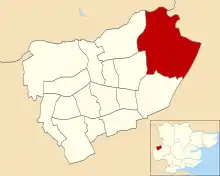
Location of Old Harlow ward
| Party | Candidate | Votes | % | |
|---|---|---|---|---|
| Labour | C. Cochrane | 1,054 | 40.0% | |
| Alliance | P. Ramsay | 801 | 30.4% | |
| Conservative | R. Cross | 779 | 29.6% | |
| Turnout | 58.3% | |||
| Labour gain from Conservative | ||||
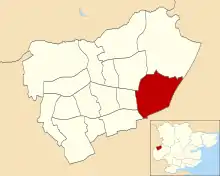
Passmores
Location of Passmores ward
| Party | Candidate | Votes | % | |
|---|---|---|---|---|
| Labour | R. Rowland | 806 | 44.8% | |
| Alliance | D. Filler | 746 | 41.5% | |
| Conservative | M. Tombs | 246 | 13.7% | |
| Turnout | 44.0% | |||
| Labour hold | ||||
Potter Street
Location of Potter Street ward
| Party | Candidate | Votes | % | |
|---|---|---|---|---|
| Labour | W. Gibson | 907 | 56.5% | |
| Alliance | A. Lee | 529 | 33.0% | |
| Conservative | N. Dean | 168 | 10.5% | |
| Turnout | 49.4% | |||
| Labour hold | ||||
References
- "Council compositions by year". The Elections Centre.
- "Local Election Summaries 1983". The Elections Centre.
- "Harlow District Council Election Results 1973-2012" (PDF). Elections Centre. Retrieved 27 September 2019.
| Metropolitan boroughs |
|
|---|---|
| District councils (England) |
|
| District councils (Wales) |
|
| |
This article is issued from Wikipedia. The text is licensed under Creative Commons - Attribution - Sharealike. Additional terms may apply for the media files.