2010 Bassetlaw District Council election
The 2010 Bassetlaw District Council election took place on 6 May 2010 to elect members of Bassetlaw District Council in Nottinghamshire, England as part of the 2010 United Kingdom local elections. One third of the council was up for election.
| |||||||||||||||||||||
One third of seats to Bassetlaw District Council (16 seats) 25 seats needed for a majority | |||||||||||||||||||||
|---|---|---|---|---|---|---|---|---|---|---|---|---|---|---|---|---|---|---|---|---|---|
| Turnout | 61.4% | ||||||||||||||||||||
| |||||||||||||||||||||
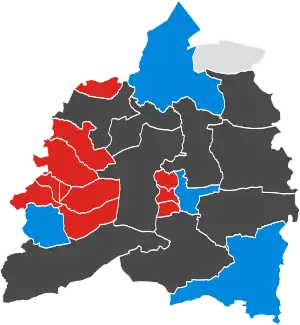 No election Colours denote the winning party, as shown in the main table of results. | |||||||||||||||||||||
| |||||||||||||||||||||
Election result
| Overall result | ||||
|---|---|---|---|---|
| Party | Seats (2010) |
Seats (Council) |
Seats (Change) | |
| Conservative | 4 | 25 | -5 | |
| Labour | 11 | 20 | +4 | |
| Independent | 1 | 3 | +1 | |
| Registered electors | 68,779 | |||
| Votes cast | 42,220 | |||
| Turnout | 61.4% | |||
Ward Results
Carlton
| Party | Candidate | Votes | % | ±% | |
|---|---|---|---|---|---|
| Labour | Robin Carrington-Wilde | 1,628 | 54.8% | ||
| Conservative | Helen Stuttard Colton | 1,342 | 45.2% | ||
| Turnout | 2,970 | 64.0% | |||
| Registered electors | 4,638 | ||||
East Retford East
| Party | Candidate | Votes | % | ±% | |
|---|---|---|---|---|---|
| Conservative | Wendy Quigley | 1,869 | 55.0% | ||
| Labour | Jim Anderson | 1,532 | 45.0% | ||
| Turnout | 3,401 | 64.3% | |||
| Registered electors | 5,289 | ||||
East Retford North
| Party | Candidate | Votes | % | ±% | |
|---|---|---|---|---|---|
| Labour | Graham Oxby | 1,619 | 53.1% | ||
| Conservative | Emma Auckland | 1,146 | 37.6% | ||
| BNP | David Otter | 282 | 9.3% | ||
| Turnout | 3,047 | 63.1% | |||
| Registered electors | 4,830 | ||||
East Retford South
| Party | Candidate | Votes | % | ±% | |
|---|---|---|---|---|---|
| Labour | Carolyn Troop | 1,287 | 63.8% | ||
| Conservative | Ferzanna Riley | 730 | 36.2% | ||
| Turnout | 2,017 | 62.9% | |||
| Registered electors | 3,206 | ||||
East Retford West
| Party | Candidate | Votes | % | ±% | |
|---|---|---|---|---|---|
| Labour | Ian Campbell | 782 | 37.9% | ||
| Conservative | Chris Hollands | 767 | 37.2% | ||
| Liberal Democrats | David Hassett | 515 | 25.0% | ||
| Turnout | 2,064 | 57.2% | |||
| Registered electors | 3,607 | ||||
Everton
| Party | Candidate | Votes | % | ±% | |
|---|---|---|---|---|---|
| Conservative | Annette Simpson | 732 | 56.4% | ||
| Independent | Chris Stringer | 566 | 43.6% | ||
| Turnout | 1,298 | 71.8% | |||
| Registered electors | 1,809 | ||||
Harworth
| Party | Candidate | Votes | % | ±% | |
|---|---|---|---|---|---|
| Labour | Frank Hart | 2,345 | 72.5% | ||
| Conservative | Steve Harwood-Gray | 891 | 27.5% | ||
| Turnout | 3,236 | 56.9% | |||
| Registered electors | 5,691 | ||||
Langold
| Party | Candidate | Votes | % | ±% | |
|---|---|---|---|---|---|
| Labour | Jill Freeman | 857 | 78.0% | ||
| Conservative | Pat Grant | 242 | 22.0% | ||
| Turnout | 1,099 | 61.2% | |||
| Registered electors | 1,795 | ||||
Misterton
| Party | Candidate | Votes | % | ±% | |
|---|---|---|---|---|---|
| Independent | Hazel Brand | 773 | 58.3% | ||
| Conservative | Raymond Simpson | 554 | 41.7% | ||
| Turnout | 1,327 | 67.8% | |||
| Registered electors | 1,958 | ||||
Tuxford and Trent
| Party | Candidate | Votes | % | ±% | |
|---|---|---|---|---|---|
| Conservative | Keith Isard | 1,264 | 57.4% | ||
| Labour | Bert Hunt | 937 | 42.6% | ||
| Turnout | 2,201 | 64.3% | |||
| Registered electors | 3,424 | ||||
Worksop East
| Party | Candidate | Votes | % | ±% | |
|---|---|---|---|---|---|
| Labour | Griff Wynne | 2,090 | 70.1% | ||
| Independent | Geoff Coe | 893 | 29.9% | ||
| Turnout | 2,983 | 60.2% | |||
| Registered electors | 4,952 | ||||
Worksop North
| Party | Candidate | Votes | % | ±% | |
|---|---|---|---|---|---|
| Labour | David Potts | 2,428 | 62.1% | ||
| Conservative | Peter Ashford | 1,480 | 37.9% | ||
| Turnout | 3,908 | 60.7% | |||
| Registered electors | 6,439 | ||||
Worksop North East
| Party | Candidate | Votes | % | ±% | |
|---|---|---|---|---|---|
| Labour | Shirley Toms | 2,110 | 64.1% | ||
| Conservative | Alec Thorpe | 1,184 | 35.9% | ||
| Turnout | 3,294 | 66.2% | |||
| Registered electors | 4,975 | ||||
Worksop North West
| Party | Candidate | Votes | % | ±% | |
|---|---|---|---|---|---|
| Labour | David Pressley | 2,146 | 66.6% | ||
| Conservative | Vincent Audritt | 1,077 | 33.4% | ||
| Turnout | 3,223 | 59.7% | |||
| Registered electors | 5,396 | ||||
Worksop South
| Party | Candidate | Votes | % | ±% | |
|---|---|---|---|---|---|
| Conservative | Chris Wanless | 1,823 | 53.3% | ||
| Labour | Kevin Greaves | 1,600 | 46.7% | ||
| Turnout | 3,423 | 62.4% | |||
| Registered electors | 5,359 | ||||
Worksop South East
| Party | Candidate | Votes | % | ±% | |
|---|---|---|---|---|---|
| Labour | Brian Hopkinson | 2,024 | 74.2% | ||
| Liberal Democrats | Mark Hunter | 386 | 14.1% | ||
| Conservative | Catherine Parrish | 319 | 11.7% | ||
| Turnout | 2,729 | 50.4% | |||
| Registered electors | 5,411 | ||||
References
- Bassetlaw District Council Election Results 2010 Archived 16 July 2011 at the Wayback Machine
This article is issued from Wikipedia. The text is licensed under Creative Commons - Attribution - Sharealike. Additional terms may apply for the media files.