2010 Derby City Council election
The 2010 Derby City Council election took place on 5 May 2010 to elect members of Derby City Council in England. One third of the council was up for election and the council remained under No Overall Control.
| |||||||||||||||||||||||||||||||||||||
17 of the 51 seats to Derby City Council 26 seats needed for a majority | |||||||||||||||||||||||||||||||||||||
|---|---|---|---|---|---|---|---|---|---|---|---|---|---|---|---|---|---|---|---|---|---|---|---|---|---|---|---|---|---|---|---|---|---|---|---|---|---|
| |||||||||||||||||||||||||||||||||||||
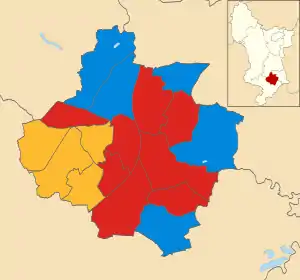 Map showing the results of contested wards in the 2010 Derby City Council elections. | |||||||||||||||||||||||||||||||||||||
| |||||||||||||||||||||||||||||||||||||
Election result
| Party | Seats | Gains | Losses | Net gain/loss | Seats % | Votes % | Votes | +/− | |
|---|---|---|---|---|---|---|---|---|---|
| Labour | 8 | 2 | 1 | 47.1 | 34.4 | 37,747 | |||
| Conservative | 5 | 2 | 0 | 29.4 | 33.7 | 36,908 | |||
| Liberal Democrats | 4 | 0 | 3 | 23.5 | 27.2 | 29,767 | |||
| BNP | 0 | 0 | 0 | 0.0 | 2.7 | 2,908 | New | ||
| Independent | 0 | 0 | 0 | 0.0 | 1.5 | 1,641 | |||
| Green | 0 | 0 | 0 | 0.0 | 0.6 | 695 | |||
All comparisons in vote share are to the corresponding 2006 election.
Ward results
Abbey

Location of Abbey ward
| Party | Candidate | Votes | % | |
|---|---|---|---|---|
| Liberal Democrats | Ajit Atwal | 2,114 | 38.2 | |
| Labour | Afzal Asaf | 2,106 | 38.1 | |
| Conservative | David Taylor | 1,313 | 23.7 | |
| Turnout | ||||
| Liberal Democrats hold | ||||
Allestree
Location of Allestree ward
| Party | Candidate | Votes | % | |
|---|---|---|---|---|
| Conservative | Roy Michael Webb | 4,908 | 58.7 | |
| Liberal Democrats | Deena Smith | 1,841 | 22.0 | |
| Labour | Robyn Joy Sewter | 1,608 | 19.3 | |
| Turnout | ||||
| Conservative hold | ||||
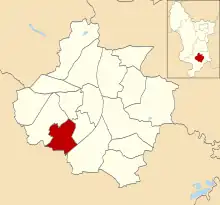
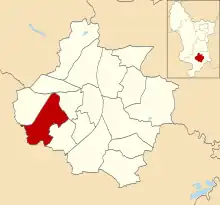
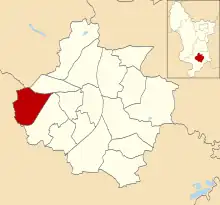
Alvaston
Location of Alvaston ward
| Party | Candidate | Votes | % | |
|---|---|---|---|---|
| Labour | Linda Mary Winter | 2,344 | 37.9 | |
| Conservative | Gerald Desmond Potter | 1,590 | 25.7 | |
| Liberal Democrats | Gill Withers | 1,430 | 23.1 | |
| Independent | Kevin Winson | 823 | 13.3 | |
| Turnout | ||||
| Labour gain from Liberal Democrats | ||||
Arboretum
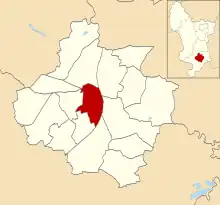
Location of Arboretum ward
| Party | Candidate | Votes | % | |
|---|---|---|---|---|
| Labour | Shiraz Khan | 2,732 | 48.8 | |
| Liberal Democrats | Rehmat Khan | 2,132 | 38.0 | |
| Conservative | Ashley Waterhouse | 739 | 13.2 | |
| Turnout | ||||
| Labour gain from Liberal Democrats | ||||
Blagreaves
Location of Blagreaves ward
| Party | Candidate | Votes | % | |
|---|---|---|---|---|
| Liberal Democrats | Ruth Skelton | 3,145 | 47.2 | |
| Labour | Shaz Parveen | 1,947 | 29.2 | |
| Conservative | Singh Dard Tarlochan | 1,566 | 23.5 | |
| Turnout | ||||
| Liberal Democrats hold | ||||
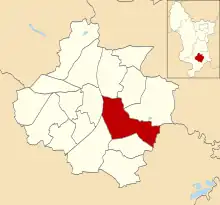
Boulton
Location of Boulton ward
| Party | Candidate | Votes | % | |
|---|---|---|---|---|
| Labour | Ranjit Banwait | 3,410 | 55.6 | |
| Conservative | Phil Bailey | 1,689 | 27.5 | |
| Liberal Democrats | Kyle Martin David | 824 | 13.4 | |
| Green | David Leonard Foster | 213 | 3.5 | |
| Turnout | ||||
| Labour hold | ||||
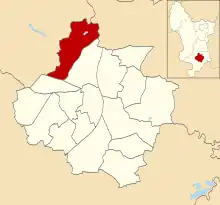
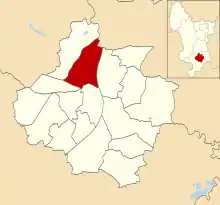
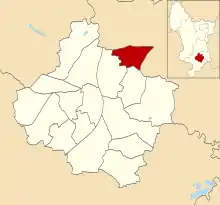
Chaddesden
Location of Chaddesten ward
| Party | Candidate | Votes | % | |
|---|---|---|---|---|
| Labour | Sara Frances Bolton | 2,614 | 40.9 | |
| Conservative | Steve Hassell | 2,161 | 33.8 | |
| Liberal Democrats | Roger Anthony Jackson | 879 | 13.8 | |
| BNP | Paul Hilliard | 733 | 11.5 | |
| Turnout | ||||
| Labour hold | ||||
Chellaston
Location of Chellaston ward
| Party | Candidate | Votes | % | |
|---|---|---|---|---|
| Conservative | Phil Ingall | 3,626 | 48.9 | |
| Labour | Andy Findlay | 2,439 | 32.9 | |
| Liberal Democrats | Waleed Hussain | 946 | 12.7 | |
| Independent | Paul Randle | 412 | 5.6 | |
| Turnout | ||||
| Conservative gain from Labour | ||||
Darley
Location of Darley ward
| Party | Candidate | Votes | % | |
|---|---|---|---|---|
| Conservative | Lorraine Mary Radford | 2,608 | 36.9 | |
| Liberal Democrats | Julie Dorothy Cooper | 2,176 | 30.8 | |
| Labour | Richard Leslie Felix | 1,799 | 25.5 | |
| Green | Jane Sarah Temple | 482 | 6.8 | |
| Turnout | ||||
| Conservative gain from Liberal Democrats | ||||
Derwent
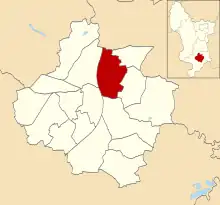
Location of Derwent ward
| Party | Candidate | Votes | % | |
|---|---|---|---|---|
| Labour | Dave Roberts | 2,164 | 42.5 | |
| Conservative | Lisa Ann Harper | 1,333 | 26.2 | |
| Liberal Democrats | John Edward Ahern | 968 | 20.0 | |
| BNP | Alex Johnstone | 633 | 12.4 | |
| Turnout | ||||
| Labour hold | ||||
Littleover
Location of Littleover ward
| Party | Candidate | Votes | % | |
|---|---|---|---|---|
| Liberal Democrats | Eric Ashburner | 3,156 | 41.5 | |
| Conservative | Maxwell Craven | 2,450 | 32.3 | |
| Labour | Karen Hillier-Smith | 1,991 | 26.2 | |
| Turnout | ||||
| Liberal Democrats hold | ||||
Mackworth
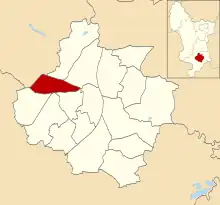
Location of Mackworth ward
| Party | Candidate | Votes | % | |
|---|---|---|---|---|
| Labour | John Michael Whitby | 2,055 | 36.7 | |
| Liberal Democrats | Catrin Sian Rutland | 1,547 | 27.6 | |
| Conservative | Adrian Pegg | 1,446 | 25.8 | |
| BNP | Raymond Herbert Dixon | 554 | 9.9 | |
| Turnout | ||||
| Labour hold | ||||
Mickleover
Location of Mickleover ward
| Party | Candidate | Votes | % | |
|---|---|---|---|---|
| Liberal Democrats | Fay Winter | 3,342 | 40.3 | |
| Conservative | John Harold Keith | 2,984 | 36.0 | |
| Labour | Lester John Pendrey | 1,549 | 18.7 | |
| BNP | Jonathan Barlow | 411 | 5.0 | |
| Turnout | ||||
| Liberal Democrats hold | ||||
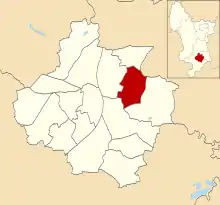
Normanton

Location of Normanton ward
| Party | Candidate | Votes | % | |
|---|---|---|---|---|
| Labour | Chris Williamson | 2,859 | 52.3% | |
| Liberal Democrats | Tafseer Habib | 1,566 | 28.7% | |
| Conservative | Lisa Jane Marshall | 881 | 16.1% | |
| Independent | Zbigniew Wójcik | 156 | 2.9% | |
| Turnout | ||||
| Labour hold | ||||
Oakwood
Location of Oakwood ward
| Party | Candidate | Votes | % | |
|---|---|---|---|---|
| Conservative | Mick Barker | 3,131 | 47.0% | |
| Liberal Democrats | Gary Bélà Horvath | 1,804 | 27.1% | |
| Labour | Richard Thomas Gerrard | 1,732 | 26.0% | |
| Turnout | ||||
| Conservative hold | ||||
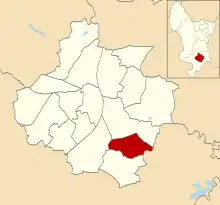
Sinfin

Location of Sinfin ward
| Party | Candidate | Votes | % | |
|---|---|---|---|---|
| Labour | Robin Cyril Turner | 2,446 | 50.1% | |
| Conservative | Mike Cook | 1,335 | 27.3% | |
| Liberal Democrats | Russell Hastie | 853 | 17.5% | |
| Independent | Steve Powell | 250 | 5.1% | |
| Turnout | ||||
| Labour hold | ||||
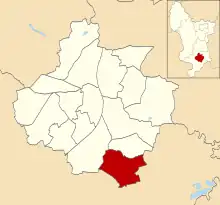
Spondon
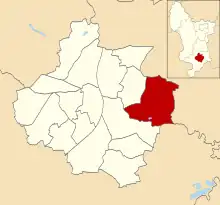
Location of Spondon ward
| Party | Candidate | Votes | % | |
|---|---|---|---|---|
| Conservative | Christopher Paul Poulter | 3,148 | 47.0% | |
| Labour | Richard Morgan | 1,952 | 29.2% | |
| Liberal Democrats | Simon Kirkman King | 1,044 | 15.6% | |
| BNP | Stephen Roland Hill | 547 | 8.2% | |
| Turnout | ||||
| Conservative hold | ||||
Notes and references
- Notes
- References
- "Local Election Results 2010". Derby City Council.
- "Local Election Results 2010". Andrew Teale.
- "Election 2010 Derby Council". BBC News. 8 May 2010.
This article is issued from Wikipedia. The text is licensed under Creative Commons - Attribution - Sharealike. Additional terms may apply for the media files.