1986 City of Lincoln Council election
The 1986 City of Lincoln Council election took place on 8 May 1986. This was on the same day as other local elections. One third of the council was up for election: the seats of which were last contested in 1982. The Labour Party retained control of the council.
| |||||||||||||||||||||||||
11 of the 33 seats to City of Lincoln Council 17 seats needed for a majority | |||||||||||||||||||||||||
|---|---|---|---|---|---|---|---|---|---|---|---|---|---|---|---|---|---|---|---|---|---|---|---|---|---|
| |||||||||||||||||||||||||
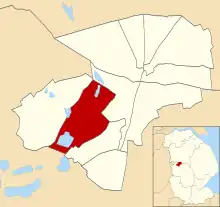
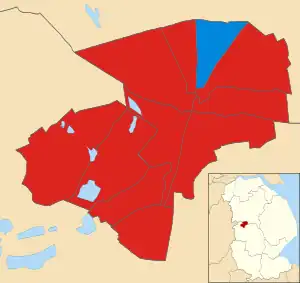 Map showing the results the 1986 Lincoln City Council elections by ward. Red shows Labour seats and blue shows Conservative seats. | |||||||||||||||||||||||||
| |||||||||||||||||||||||||
Overall results
| Party | Seats | Gains | Losses | Net gain/loss | Seats % | Votes % | Votes | +/− | |
|---|---|---|---|---|---|---|---|---|---|
| Labour | 11 | 1 | 0 | 91.7 | 58.0 | 13,625 | |||
| Conservative | 1 | 0 | 1 | 8.3 | 35.4 | 8,311 | |||
| Alliance | 0 | 0 | 0 | 0.0 | 5.0 | 1,169 | |||
| Green | 0 | 0 | 0 | 0.0 | 1.6 | 378 | |||
| Total | 12 | 23,483 | |||||||
All comparisons in vote share are to the corresponding 1982 election.
Ward results
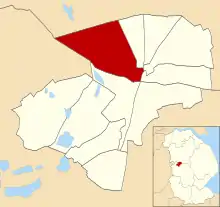
Abbey
Location of Abbey ward
| Party | Candidate | Votes | % | |
|---|---|---|---|---|
| Labour | A. Gibbons | 1,549 | 75.3% | |
| Conservative | H. Nicholson | 509 | 24.7% | |
| Turnout | 38.3% | |||
| Labour hold | ||||
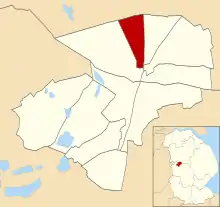
Birchwood
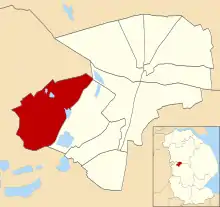
Location of Birchwood ward
| Party | Candidate | Votes | % | |
|---|---|---|---|---|
| Labour | B. Freeborough | 1,245 | 54.7% | |
| Conservative | J. Calland | 1,032 | 45.3% | |
| Turnout | 33.2% | |||
| Labour hold | ||||
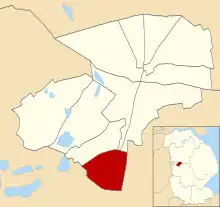
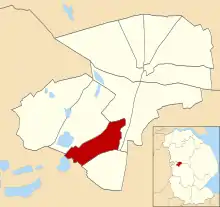
Boultham

Location of Boultham ward
| Party | Candidate | Votes | % | |
|---|---|---|---|---|
| Labour | P. Archer | 1,307 | 64.7% | |
| Conservative | M. Mellows | 713 | 35.3% | |
| Turnout | 39.7% | |||
| Labour hold | ||||
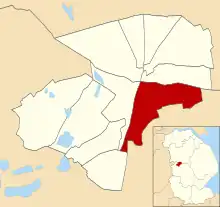
Bracebridge
Location of Bracebridge ward
| Party | Candidate | Votes | % | |
|---|---|---|---|---|
| Labour | Bud Robinson[4] | 1,169 | 51.7% | |
| Conservative | R. Bracey | 1,090 | 48.3% | |
| Turnout | 37.7% | |||
| Labour gain from Conservative | ||||
Carholme
Location of Carholme ward
| Party | Candidate | Votes | % | |
|---|---|---|---|---|
| Labour | L. Vaisey | 834 | 40.8% | |
| Conservative | J. Fawcett | 626 | 30.6% | |
| Alliance | K. Harrison | 474 | 23.2% | |
| Green | P. Boizot | 111 | 5.4% | |
| Turnout | 37.6% | |||
| Labour gain from Conservative | ||||
Castle (2 seats)
Location of Castle ward
| Party | Candidate | Votes | % | |
|---|---|---|---|---|
| Labour | H. Bunnage | 1,402 | ||
| Labour | Loraine Woolley[5] | 1,310 | ||
| Conservative | P. Adams | 650 | ||
| Conservative | J. Fawcett | 632 | ||
| Green | B. Alford | 157 | ||
| Turnout | 40.9% | |||
| Labour hold | ||||
| Labour hold | ||||
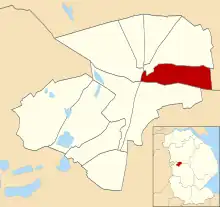
Longdales

Location of Longdales ward
| Party | Candidate | Votes | % | |
|---|---|---|---|---|
| Conservative | N. McDonald | 1,150 | 44.2% | |
| Labour | B. Watson | 1,143 | 43.9% | |
| Alliance | B. Smith | 311 | 11.9% | |
| Turnout | 52.4% | |||
| Conservative hold | ||||
Minster

Location of Minster ward
| Party | Candidate | Votes | % | |
|---|---|---|---|---|
| Labour | Richard Metcalfe[6] | 1,720 | 61.7% | |
| Conservative | F. Horn | 1,069 | 38.3% | |
| Turnout | 43.0% | |||
| Labour hold | ||||
Moorland
Location of Moorland ward
| Party | Candidate | Votes | % | |
|---|---|---|---|---|
| Labour | Geoffrey Ellis[7] | 1,173 | 64.0% | |
| Conservative | M. Campbell | 661 | 36.0% | |
| Turnout | 37.3% | |||
| Labour hold | ||||
References
- "Council compositions by year". The Elections Centre.
- "Local Election Summaries 1986". The Elections Centre.
- "City of Lincoln Council Election Results 1973-2012". Elections Centre. Retrieved 29 October 2019.
- "Councillors - Bracebridge ward". Archived from the original on 19 April 2003. Retrieved 4 November 2019.
- "Councillors - Castle ward". Archived from the original on 19 April 2003. Retrieved 4 November 2019.
- "Councillors - Glebe ward". Archived from the original on 19 April 2003. Retrieved 4 November 2019.
- "Councillors - Moorland ward". Archived from the original on 19 April 2003. Retrieved 5 November 2019.
| Lincolnshire County Council | |||||||||||||||||||||
|---|---|---|---|---|---|---|---|---|---|---|---|---|---|---|---|---|---|---|---|---|---|
| Boston Borough Council | |||||||||||||||||||||
| East Lindsey District Council | |||||||||||||||||||||
| City of Lincoln Council | |||||||||||||||||||||
| North East Lincolnshire Council | |||||||||||||||||||||
| North Kesteven District Council | |||||||||||||||||||||
| North Lincolnshire Council | |||||||||||||||||||||
| South Holland District Council | |||||||||||||||||||||
| South Kesteven District Council | |||||||||||||||||||||
| West Lindsey District Council | |||||||||||||||||||||
| |||||||||||||||||||||
| |||||||||||||||||||||
| London boroughs |
|
|---|---|
| Metropolitan boroughs |
|
| District councils (England) |
|
| Regional councils (Scotland) |
|
| LEAs | |
This article is issued from Wikipedia. The text is licensed under Creative Commons - Attribution - Sharealike. Additional terms may apply for the media files.