1983 City of Lincoln Council election
The 1983 City of Lincoln Council election took place on 5 May 1983. This was on the same day as other local elections. One third of the council was up for election: the seats of the top-polling candidates at the all out election of 1979. The Labour Party retained control of the council.
| |||||||||||||||||||||||||
11 of the 33 seats to City of Lincoln Council 17 seats needed for a majority | |||||||||||||||||||||||||
|---|---|---|---|---|---|---|---|---|---|---|---|---|---|---|---|---|---|---|---|---|---|---|---|---|---|
| |||||||||||||||||||||||||
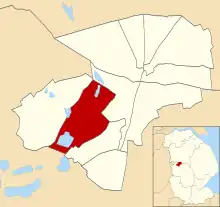
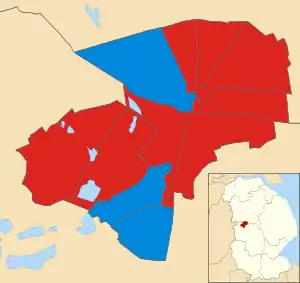 Map showing the results the 1983 Lincoln City Council elections by ward. Red shows Labour seats and blue shows the Conservatives seats. | |||||||||||||||||||||||||
| |||||||||||||||||||||||||
Overall results
| Party | Seats | Gains | Losses | Net gain/loss | Seats % | Votes % | Votes | +/− | |
|---|---|---|---|---|---|---|---|---|---|
| Labour | 8 | 3 | 0 | 72.7 | 46.4 | 12,532 | |||
| Conservative | 3 | 0 | 3 | 27.3 | 39.2 | 10,575 | |||
| Alliance | 0 | 0 | 0 | 0.0 | 13.2 | 3,561 | |||
| Ecology | 0 | 0 | 0 | 0.0 | 0.7 | 181 | |||
| Independent Labour | 0 | 0 | 0 | 0.0 | 0.4 | 118 | |||
| Rev Reform | 0 | 0 | 0 | 0.0 | 0.0 | 17 | |||
| Total | 11 | 26,984 | |||||||
Ward results
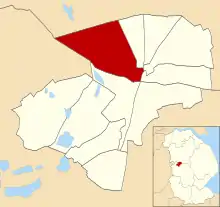
Abbey
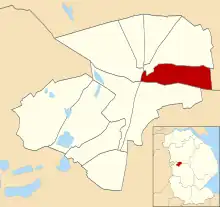
Location of Abbey ward
| Party | Candidate | Votes | % | |
|---|---|---|---|---|
| Labour | Peter West[4] | 1,150 | 51.2% | |
| Conservative | J. Frost | 722 | 32.2% | |
| Alliance | M. Sedgwick | 372 | 16.6% | |
| Turnout | 41.5% | |||
| Labour hold | ||||
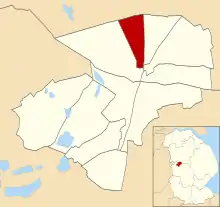
Birchwood
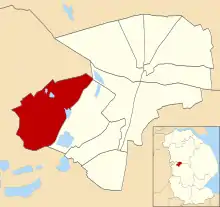
Location of Birchwood ward
| Party | Candidate | Votes | % | |
|---|---|---|---|---|
| Labour | Lawrence Wells[5] | 910 | 40.9% | |
| Conservative | W. Crumblehulme | 864 | 38.8% | |
| Labour | L. Retallack | 418 | 18.8% | |
| Independent Labour | K. Erskine | 34 | 1.5% | |
| Turnout | 40.2% | |||
| Labour gain from Conservative | ||||
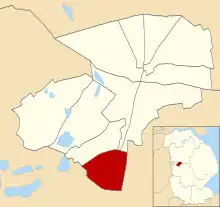
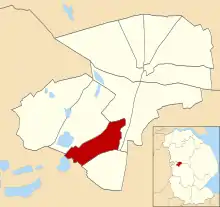
Boultham

Location of Boultham ward
| Party | Candidate | Votes | % | |
|---|---|---|---|---|
| Labour | T. Rook | 1,305 | 52.1% | |
| Conservative | P. Samways | 870 | 34.7% | |
| Alliance | L. Davis | 264 | 10.5% | |
| Ecology | C. Moulton | 65 | 2.6% | |
| Turnout | 51.3% | |||
| Labour hold | ||||
Note: T. Rook had been elected as a Democratic Labour councillor in 1979[3]
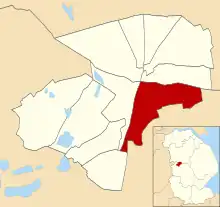
Bracebridge
Location of Bracebridge ward
| Party | Candidate | Votes | % | |
|---|---|---|---|---|
| Conservative | E. Jenkins | 1,603 | 61.3% | |
| Labour | W. Fielder | 1,011 | 38.7% | |
| Turnout | 45.4% | |||
| Conservative hold | ||||
Carholme
Location of Carholme ward
| Party | Candidate | Votes | % | |
|---|---|---|---|---|
| Conservative | S. Campbell | 1,185 | 43.3% | |
| Labour | B. Phippard | 799 | 29.2% | |
| Alliance | S. England | 684 | 25.0% | |
| Ecology | S. Moulton | 69 | 2.5% | |
| Turnout | 49.5% | |||
| Conservative hold | ||||
Castle
Location of Castle ward
| Party | Candidate | Votes | % | |
|---|---|---|---|---|
| Labour | Anthony Morgan[6] | 1,419 | 55.8% | |
| Conservative | M. Mellows | 766 | 30.1% | |
| Alliance | E. Thompson | 356 | 14.0% | |
| Turnout | 49.1% | |||
| Labour hold | ||||
Longdales

Location of Longdales ward
| Party | Candidate | Votes | % | |
|---|---|---|---|---|
| Labour | Neil Murray[7] | 1,160 | 46.0% | |
| Conservative | C. North | 979 | 38.8% | |
| Alliance | R. Barnes | 356 | 14.1% | |
| Independent Labour | M. King | 27 | 1.1% | |
| Turnout | 51.4% | |||
| Labour gain from Conservative | ||||
Minster

Location of Minster ward
| Party | Candidate | Votes | % | |
|---|---|---|---|---|
| Labour | Jerome O'Brien[5] | 1,481 | 44.8% | |
| Conservative | J. Sullivan | 1,352 | 40.9% | |
| Alliance | C. Davis | 415 | 12.6% | |
| Independent Labour | N. Erskin | 57 | 1.7% | |
| Turnout | 53.9% | |||
| Labour gain from Conservative | ||||
Moorland
Location of Moorland ward
| Party | Candidate | Votes | % | |
|---|---|---|---|---|
| Conservative | B. Abbott | 1,051 | 46.5% | |
| Labour | R. Hodson | 949 | 42.0% | |
| Alliance | C. Robins | 243 | 10.8% | |
| Rev Reform | T. Kyle | 17 | 0.8% | |
| Turnout | 45.7% | |||
| Conservative hold | ||||
Park
Location of Park ward
| Party | Candidate | Votes | % | |
|---|---|---|---|---|
| Labour | David Jackson[8] | 1,004 | 48.1% | |
| Conservative | K. Pullen | 582 | 27.9% | |
| Alliance | F. Allen | 453 | 21.7% | |
| Ecology | G. Bosworth | 47 | 2.3% | |
| Turnout | 41.9% | |||
| Labour hold | ||||
Tritton
Location of Tritton ward
| Party | Candidate | Votes | % | |
|---|---|---|---|---|
| Labour | R. Hurst | 1,344 | 69.1% | |
| Conservative | R. Seale | 601 | 30.9% | |
| Turnout | 44.8% | |||
| Labour hold | ||||
References
- "Council compositions by year". The Elections Centre.
- "Local Election Summaries 1983". The Elections Centre.
- "City of Lincoln Council Election Results 1973-2012". Elections Centre. Retrieved 29 October 2019.
- "Councillors - Abbey ward". Archived from the original on 19 April 2003. Retrieved 4 November 2019.
- "Councillors - Glebe ward". Archived from the original on 19 April 2003. Retrieved 4 November 2019.
- "Councillors - Castle ward". Archived from the original on 19 April 2003. Retrieved 4 November 2019.
- "Councillors - Castle ward". Archived from the original on 26 August 2003. Retrieved 5 November 2019.
- "Councillors - Park ward". Archived from the original on 19 April 2003. Retrieved 5 November 2019.
| Lincolnshire County Council | |||||||||||||||||||||
|---|---|---|---|---|---|---|---|---|---|---|---|---|---|---|---|---|---|---|---|---|---|
| Boston Borough Council | |||||||||||||||||||||
| East Lindsey District Council | |||||||||||||||||||||
| City of Lincoln Council | |||||||||||||||||||||
| North East Lincolnshire Council | |||||||||||||||||||||
| North Kesteven District Council | |||||||||||||||||||||
| North Lincolnshire Council | |||||||||||||||||||||
| South Holland District Council | |||||||||||||||||||||
| South Kesteven District Council | |||||||||||||||||||||
| West Lindsey District Council | |||||||||||||||||||||
| |||||||||||||||||||||
| |||||||||||||||||||||
| Metropolitan boroughs |
|
|---|---|
| District councils (England) |
|
| District councils (Wales) |
|
| |
This article is issued from Wikipedia. The text is licensed under Creative Commons - Attribution - Sharealike. Additional terms may apply for the media files.