2020 United States presidential election in Minnesota
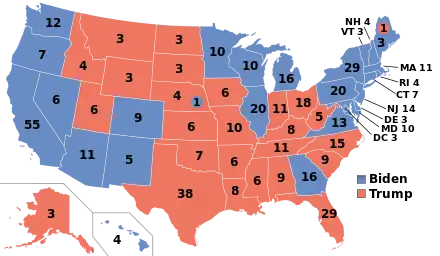
The 2020 United States presidential election in Minnesota was held on Tuesday, November 3, 2020, as part of the 2020 United States presidential election in which all 50 states plus the District of Columbia participated.[2] Minnesota voters chose electors to represent them in the Electoral College via a popular vote, pitting the Republican Party's nominee, incumbent President Donald Trump, and running mate Vice President Mike Pence against Democratic Party nominee, former Vice President Joe Biden, and his running mate California Senator Kamala Harris. Minnesota has ten electoral votes in the Electoral College.[3]
| ||||||||||||||||||||||||||
| Turnout | 79.96% (of eligible voters) [1] | |||||||||||||||||||||||||
|---|---|---|---|---|---|---|---|---|---|---|---|---|---|---|---|---|---|---|---|---|---|---|---|---|---|---|
| ||||||||||||||||||||||||||


| ||||||||||||||||||||||||||
| ||||||||||||||||||||||||||
.jpg.webp)
.jpg.webp)
| Elections in Minnesota |
|---|
 |
Prior to the election, 15 out of 16 news organizations projected Minnesota as leaning towards Biden. Minnesota was ultimately carried by Biden by a 7.12% margin, significantly improving over Hillary Clinton's narrow 1.52% margin in 2016. Biden's win marked the twelfth consecutive Democratic presidential win in the state, which has not voted for a Republican since Richard Nixon in 1972, making it the state with the longest Democratic streak still in effect today.
Biden flipped four counties Trump carried in 2016: Clay (Moorhead), Nicollet (North Mankato and St. Peter), Blue Earth (Mankato), and Winona (anchored by the city of the same name), all of which were won by Barack Obama in 2008 and 2012. The key to Biden's success was his performance in the Twin Cities metro area;[4] he outperformed both Clinton and Obama (in either 2008 or 2012) there. His vote share in Hennepin was the highest of any nominee's since Theodore Roosevelt's in 1904. He also improved on Clinton's performance in the Iron Range,[5] although his performance in St Louis, Lake, and Carlton Counties was still well below what Democrats had historically been getting since the New Deal realignment up through 2012. In addition, Biden managed to flip Minnesota's 2nd congressional district, which houses some of the Twin Cities' southern suburbs, by 6.8 points, after Trump narrowly won it by 1.2 points in the last election.
Per exit polls by the Associated Press, Biden carried 51% of White Minnesotans; as well as 58% of college educated voters, and 55% of union households.[6] Trump's areas of strength were in the more rural areas, while Biden performed better in urban and suburban areas. Biden became the first Democrat to win the White House without carrying Koochiching or Mahnomen Counties since those counties were formed in 1906, the first Democrat to win without Traverse County since Grover Cleveland in 1892, the first to win without Kittson, Norman, Itasca, or Beltrami Counties since Woodrow Wilson in 1912, the first to win without Swift County since Wilson in 1916, the first to win without Lac qui Parle County since Franklin D. Roosevelt in 1944, the first to win without Chippewa, Freeborn, Mower, or Rice Counties since John F. Kennedy in 1960, the first to win without Fillmore County since Jimmy Carter in 1976, and the first to win without Houston County since Bill Clinton in 1992. This is the first time since 1964 in which Minnesota would vote to the right of New Hampshire, another state that has almost always voted Democratic in presidential elections since 1992, albeit only by single digit margins of victory.
Primary elections
Republican primary
The Republican primary took place on March 3, 2020. Donald Trump and Bill Weld were among the declared Republican candidates.
| Candidate | Votes | % | Delegates |
|---|---|---|---|
| Donald Trump | 137,275 | 97.7 | 39 |
| Bill Weld (write-in) | 443 | 0.3 | 0 |
| Rocky De La Fuente (write-in) | 16 | 0.0 | 0 |
| Other write-ins | 2,821 | 2.0 | 0 |
| Total | 140,555 | 100.0 | 39 (of 39) |
Democratic primary
The Democratic primary took place on March 3, 2020. Elizabeth Warren, Bernie Sanders, and former Vice President Joe Biden were among the major declared candidates.[9] Amy Klobuchar, U.S. Senator from Minnesota since 2007, expressed interest in running, and formally declared her candidacy in February 2019,[10][11][12] but then withdrew prior to Minnesota's race.
Biden won the most delegates.[13]
%252C_2020.svg.png.webp)
| Candidate | Votes | % | Delegates[15] |
|---|---|---|---|
| Joe Biden | 287,553 | 38.64 | 38 |
| Bernie Sanders | 222,431 | 29.89 | 27 |
| Elizabeth Warren | 114,674 | 15.41 | 10 |
| Michael Bloomberg | 61,882 | 8.32 | |
| Amy Klobuchar (withdrawn)[lower-alpha 1] | 41,530 | 5.58 | |
| Pete Buttigieg (withdrawn)[lower-alpha 1] | 7,616 | 1.02 | |
| Tulsi Gabbard | 2,504 | 0.34 | |
| Andrew Yang (withdrawn)[lower-alpha 2] | 1,749 | 0.24 | |
| Tom Steyer (withdrawn)[lower-alpha 1] | 551 | 0.07 | |
| Michael Bennet (withdrawn)[lower-alpha 2] | 315 | 0.04 | |
| Marianne Williamson (withdrawn) | 226 | 0.03 | |
| Cory Booker (withdrawn) | 197 | 0.03 | |
| John Delaney (withdrawn)[lower-alpha 3] | 172 | 0.02 | |
| Julian Castro (withdrawn) | 114 | 0.02 | |
| Deval Patrick (withdrawn)[lower-alpha 4] | 72 | 0.01 | |
| Uncommitted | 2,612 | 0.35 | |
| Total | 744,198 | 100% | 75 |
Libertarian caucuses
| ||||||||||||||||||||||||||||||||||||||||||||||||||||||||||||||||
| ||||||||||||||||||||||||||||||||||||||||||||||||||||||||||||||||
 First alignment vote results by congressional district
| ||||||||||||||||||||||||||||||||||||||||||||||||||||||||||||||||
_(3).jpg.webp)
_(crop_2).jpg.webp)
.jpg.webp)
.jpg.webp)
.png.webp)
_(cropped).jpg.webp)
.jpg.webp)
The Libertarian Party of Minnesota used ranked-choice voting to tabulate the results of their caucus. After 7 rounds, Jacob Hornberger was declared the winner.
| Candidate | Round 1 | Round 7 | |||||||||
|---|---|---|---|---|---|---|---|---|---|---|---|
| Votes | % | Transfer | Votes | % | |||||||
| Jacob Hornberger | 37 | 38.1% | + 10 | 47 | 59.5% | ||||||
| Jo Jorgensen | 12 | 12.4% | + 20 | 32 | 40.5% | ||||||
| Vermin Supreme | 11 | 11.3% | - 11 | Eliminated | |||||||
| Adam Kokesh | 6 | 6.2% | - 6 | Eliminated | |||||||
| John Monds | 6 | 6.2% | - 6 | Eliminated | |||||||
| Lincoln Chafee | 6 | 6.2% | - 6 | Eliminated | |||||||
| Mark Whitney | 6 | 6.2% | - 6 | Eliminated | |||||||
| N.O.T.A. | 4 | 4.1% | - 4 | Eliminated | |||||||
| Arvin Vohra | 2 | 2.1% | - 2 | Eliminated | |||||||
| Ken Armstrong | 2 | 2.1% | - 2 | Eliminated | |||||||
| Sam Robb | 2 | 2.1% | - 2 | Eliminated | |||||||
| Keenan Wallace Dunham | 1 | 1.0% | - 1 | Eliminated | |||||||
| Sorinne Ardeleanu | 1 | 1.0% | - 1 | Eliminated | |||||||
| Abrahamson [sic] (write-in) | 1 | 1.0% | - 1 | Eliminated | |||||||
| Dan "Taxation is Theft" Behrman | 0 | 0.0% | Eliminated | ||||||||
| Jedi Hill | 0 | 0.0% | Eliminated | ||||||||
| Souraya Faas | 0 | 0.0% | Eliminated | ||||||||
| Steven Richey | 0 | 0.0% | Eliminated | ||||||||
| Round 1 Total | 97 | 100.0% | Round 7 Total | 79 | 100.0% | ||||||
| Candidate | Round 1 | Round 2 | |||||||||
|---|---|---|---|---|---|---|---|---|---|---|---|
| Votes | % | Transfer | Votes | % | |||||||
| Jeff Wood | 32 | 40.0% | + 0 | 32 | 52.5% | ||||||
| Spike Cohen | 29 | 36.3% | + 0 | 29 | 47.5% | ||||||
| NOTA | 19 | 23.8% | - 19 | Eliminated | |||||||
| Round 1 Total | 80 | 100.0% | Round 2 Total | 61 | 100.0% | ||||||
General election
Final predictions
| Source | Ranking |
|---|---|
| The Cook Political Report[19] | Lean D |
| Inside Elections[20] | Likely D |
| Sabato's Crystal Ball[21] | Likely D |
| Politico[22] | Lean D |
| RCP[23] | Tossup |
| Niskanen[24] | Likely D |
| CNN[25] | Lean D |
| The Economist[26] | Likely D |
| CBS News[27] | Lean D |
| 270towin[28] | Likely D |
| ABC News[29] | Lean D |
| NPR[30] | Lean D |
| NBC News[31] | Lean D |
| FiveThirtyEight[32] | Solid D |
Polling
- Graphical summary
Aggregate polls
| Source of poll aggregation |
Dates administered |
Dates updated |
Joe Biden Democratic |
Donald Trump Republican |
Other/ Undecided [lower-alpha 5] |
Margin |
|---|---|---|---|---|---|---|
| 270 to Win | October 27 – November 2, 2020 | November 3, 2020 | 51.6% | 41.8% | 6.6% | Biden +9.8 |
| Real Clear Politics | October 12–27, 2020 | November 3, 2020 | 48.0% | 43.7% | 8.3% | Biden +4.3 |
| FiveThirtyEight | until November 2, 2020 | November 3, 2020 | 51.8% | 42.7% | 5.5% | Biden +9.2 |
| Average | 50.5% | 42.7% | 6.8% | Biden +7.8 | ||
- Polls
| Poll source | Date(s) administered |
Sample size[lower-alpha 6] |
Margin of error |
Donald Trump Republican |
Joe Biden Democratic |
Jo Jorgensen Libertarian |
Howie Hawkins Green |
Other | Undecided |
|---|---|---|---|---|---|---|---|---|---|
| SurveyMonkey/Axios | Oct 20 – Nov 2, 2020 | 3,031 (LV) | ± 2.5% | 41%[lower-alpha 7] | 56% | - | - | – | – |
| Research Co. | Oct 31 – Nov 1, 2020 | 450 (LV) | ± 4.6% | 45% | 54% | - | - | 1%[lower-alpha 8] | 4% |
| Data for Progress | Oct 27 – Nov 1, 2020 | 1,259 (LV) | ± 2.8% | 43% | 51% | 4% | 2% | 1%[lower-alpha 9] | – |
| Swayable Archived November 27, 2020, at the Wayback Machine | Oct 23 – Nov 1, 2020 | 466 (LV) | ± 5.9% | 43% | 53% | 4% | 0% | – | – |
| Morning Consult | Oct 22–31, 2020 | 883 (LV) | ± 3.0% | 42% | 52% | - | - | – | – |
| Public Policy Polling | Oct 29–30, 2020 | 770 (V) | – | 43% | 54% | - | - | 2%[lower-alpha 10] | 1% |
| Targoz Market Research/PollSmart | Oct 25–30, 2020 | 1,138 (LV) | – | 44% | 53% | - | - | 3%[lower-alpha 11] | – |
| St. Cloud State University | Oct 10–29, 2020 | 372 (A) | ± 6.7% | 39% | 54% | - | - | – | – |
| SurveyMonkey/Axios | Oct 1–28, 2020 | 5,498 (LV) | – | 42% | 55% | - | - | – | – |
| SurveyUSA/KSTP/ABC6 News Archived October 31, 2020, at the Wayback Machine | Oct 23–27, 2020 | 649 (LV) | ± 4.3% | 42% | 47% | - | - | 5%[lower-alpha 12] | 6% |
| Gravis Marketing | Oct 24–26, 2020 | 657 (LV) | ± 3.8% | 39% | 53% | - | - | – | 8% |
| Trafalgar Group | Oct 24–25, 2020 | 1,065 (LV) | ± 2.92% | 45% | 48% | 2% | - | 4%[lower-alpha 13] | 1% |
| Civiqs/Daily Kos | Oct 17–20, 2020 | 840 (LV) | ± 3.6% | 43% | 53% | - | - | 3%[lower-alpha 14] | 1% |
| SurveyUSA/KSTP | Oct 16–20, 2020 | 625 (LV) | ± 5% | 42% | 48% | - | - | – | – |
| Morning Consult | Oct 11–20, 2020 | 864 (LV) | ± 3.3% | 42% | 51% | - | - | – | – |
| Change Research/MinnPost | Oct 12–15, 2020[lower-alpha 15] | 1,021 (LV) | ± 3.1% | 44% | 49% | 2% | 0% | 2%[lower-alpha 16] | 2% |
| David Binder Research/Focus on Rural America | Oct 10–13, 2020 | 200 (LV) | – | 41% | 52% | - | - | – | – |
| Morning Consult | Oct 2–11, 2020 | 898 (LV) | ± 3.3% | 44% | 50% | - | - | – | – |
| SurveyUSA/ABC6 News Archived October 11, 2020, at the Wayback Machine | Oct 1–6, 2020 | 929 (LV) | ± 3.9% | 40% | 47% | - | - | 3%[lower-alpha 17] | 10% |
| SurveyMonkey/Axios | Sep 1–30, 2020 | 2,808 (LV) | – | 43% | 55% | - | - | – | 2% |
| Suffolk University | Sep 20–24, 2020 | 500 (LV) | ± 4.4% | 40% | 47% | 2% | 0% | 4%[lower-alpha 18] | 6% |
| Mason-Dixon/StarTribune /MPR News/KARE 11 |
Sep 21–23, 2020 | 800 (LV) | ± 3.5% | 42% | 48% | - | - | 2% | 8% |
| Redfield & Wilton Strategies | Sep 12–17, 2020 | 718 (LV) | ± 3.66% | 42% | 51% | 0% | 0% | 1%[lower-alpha 19] | 5% |
| ABC/Washington Post | Sep 8–13, 2020 | 615 (LV) | ± 4.5% | 41% | 57% | - | - | 1%[lower-alpha 20] | 1% |
| Morning Consult | Sep 4–13, 2020 | 643 (LV) | ± 4% | 44%[lower-alpha 21] | 48% | - | - | 2%[lower-alpha 10] | 6% |
| YouGov/CBS | Sep 9–11, 2020 | 1,087 (LV) | ± 3.9% | 41% | 50% | - | - | 2%[lower-alpha 22] | 6% |
| Siena College/NYT Upshot | Sep 8–10, 2020 | 814 (LV) | ± 3.9% | 41% | 50% | 2% | 1% | 0%[lower-alpha 23] | 5%[lower-alpha 24] |
| SurveyUSA | Sep 4–7, 2020 | 553 (LV) | ± 5.2% | 40% | 49% | - | - | 4%[lower-alpha 25] | 7% |
| Morning Consult | Aug 29 – Sep 7, 2020 | 649 (LV) | ± (2%–4%) | 44%[lower-alpha 21] | 49% | - | - | – | – |
| PPP | Sep 3–4, 2020 | 877 (V) | ± 3.3% | 44% | 52% | - | - | 3%[lower-alpha 14] | 1% |
| Harper Polling/Jason Lewis[upper-alpha 1] | Aug 30 – Sep 1, 2020 | 501 (LV) | ± 4.38% | 45% | 48% | – | – | – | 4% |
| SurveyMonkey/Axios | Aug 1–31, 2020 | 1,939 (LV) | – | 43% | 56% | - | - | – | 1% |
| Morning Consult | Aug 21–30, 2020 | 647 (LV) | ± (2%–4%) | 43% | 50% | - | - | – | – |
| Trafalgar Group | Aug 15–18, 2020 | 1,141 (LV) | ± 3.0% | 47% | 47% | 4% | - | 1%[lower-alpha 26] | 2% |
| Morning Consult | Aug 7–16, 2020 | 615 (LV) | ± (2%–4%) | 42% | 50% | - | - | – | – |
| Emerson College | Aug 8–10, 2020 | 733 (LV) | ± 3.6% | 49%[lower-alpha 27] | 51% | - | - | – | – |
| David Binder Research | Jul 30–31, 2020 | 200 (LV) | – | 36% | 54% | - | - | – | – |
| SurveyMonkey/Axios | Jul 1–31, 2020 | 2,288 (LV) | – | 47% | 51% | - | - | – | 2% |
| Morning Consult | Jul 17–26, 2020 | 662 (LV) | ± 3.8% | 44% | 47% | - | - | – | – |
| Trafalgar Group | Jul 23–25, 2020 | 1,129 (LV) | ± 2.8% | 44% | 49% | 2% | - | 3%[lower-alpha 28] | 2% |
| Public Policy Polling/Giffords Archived July 31, 2020, at the Wayback Machine[upper-alpha 2] | Jul 22–23, 2020 | 1,218 (V) | ± 3.2% | 42% | 52% | - | - | – | 6% |
| FOX News | Jul 18–20, 2020 | 776 (RV) | ± 3.5% | 38% | 51% | - | - | 6%[lower-alpha 29] | 6% |
| SurveyMonkey/Axios | Jun 8–30, 2020 | 860 (LV) | – | 42% | 57% | - | - | – | 1% |
| Gravis Marketing | Jun 19, 2020 | 600 (RV) | ± 4.0% | 42%[lower-alpha 30] | 58%[lower-alpha 31] | - | - | – | – |
| Morning Consult | May 27– Jun 5, 2020 | 600 (LV) | ± 4% | 45% | 48% | - | - | – | – |
| Harper Polling/Jason Lewis[upper-alpha 1] | May 26–28, 2020 | 510 (LV) | – | 42% | 50% | – | – | – | 8% |
| Morning Consult | May 17–26, 2020 | 647 (LV) | – | 42% | 49% | - | - | – | – |
| Mason-Dixon/StarTribune /MPR News/KARE 11 |
May 18–20, 2020 | 800 (RV) | ± 3.5% | 44% | 49% | - | - | – | 7% |
| Morning Consult | May 7–16, 2020 | 600 (LV) | ± 4% | 38% | 55% | - | - | – | – |
| Mason-Dixon/StarTribune | Oct 14–16, 2019 | 800 (RV) | ± 3.5% | 38% | 50% | - | - | – | 12% |
Former candidates | ||||||||||||||||||||||||||||||||||||||||||||||||||||||||
|---|---|---|---|---|---|---|---|---|---|---|---|---|---|---|---|---|---|---|---|---|---|---|---|---|---|---|---|---|---|---|---|---|---|---|---|---|---|---|---|---|---|---|---|---|---|---|---|---|---|---|---|---|---|---|---|---|
|
Hypothetical polling | ||||||||||||||||||||||||||||||||||||||||||||
|---|---|---|---|---|---|---|---|---|---|---|---|---|---|---|---|---|---|---|---|---|---|---|---|---|---|---|---|---|---|---|---|---|---|---|---|---|---|---|---|---|---|---|---|---|
|
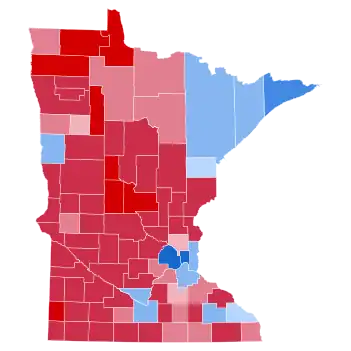
Results
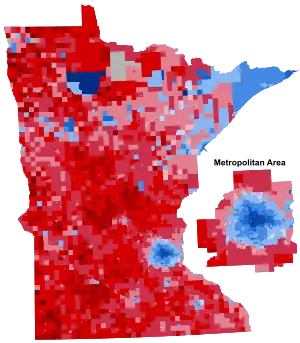
- Biden—40–50%
- Biden—50–60%
- Biden—60–70%
- Biden—70–80%
- Biden—80–90%
- Biden—90–100%
- Trump–40–50%
- Trump–50–60%
- Trump–60–70%
- Trump–70–80%
- Trump–80–90%
- Trump–90–100%
- Tie
- No Vote
| Party | Candidate | Votes | % | ±% | |
|---|---|---|---|---|---|
| Democratic (DFL) | Joe Biden Kamala Harris |
1,717,077 | 52.40% | +5.96% | |
| Republican | Donald Trump Mike Pence |
1,484,065 | 45.28% | +0.35% | |
| Libertarian | Jo Jorgensen Spike Cohen |
34,976 | 1.07% | -2.77% | |
| Green | Howie Hawkins Angela Walker |
10,033 | 0.31% | -0.95% | |
| Independent | Kanye West Michelle Tidball |
7,940 | 0.24% | - | |
| Independent | Brock Pierce Karla Ballard |
5,651 | 0.17% | - | |
| Alliance | Rocky De La Fuente Darcy Richardson |
5,611 | 0.17% | - | |
| Socialism and Liberation | Gloria La Riva Sunil Freeman |
1,210 | 0.04% | - | |
| Socialist Workers | Alyson Kennedy Malcolm Jarrett |
643 | 0.02% | -0.04% | |
| Write-in | 9,965 | 0.3% | -0.6% | ||
| Total votes | 3,277,171 | 100% | |||
Results by county
| County | Joe Biden DFL | Donald Trump Republican | Jo Jorgensen Libertarian | Other votes | Margin | Total votes | |||||
|---|---|---|---|---|---|---|---|---|---|---|---|
| % | # | % | # | % | # | % | # | % | # | ||
| Aitkin | 35.98% | 3,607 | 62.42% | 6,258 | 0.55% | 55 | 1.05% | 105 | -26.44% | -2,651 | 10,025 |
| Anoka | 47.79% | 100,893 | 49.69% | 104,902 | 1.17% | 2,475 | 1.35% | 2,862 | -1.90% | -4,009 | 211,132 |
| Becker | 33.96% | 6,589 | 64.11% | 12,438 | 0.87% | 168 | 1.06% | 206 | -30.15% | -5,849 | 19,401 |
| Beltrami | 47.24% | 11,426 | 50.39% | 12,188 | 1.06% | 256 | 1.32% | 319 | -3.15% | -762 | 24,189 |
| Benton | 32.70% | 7,280 | 64.61% | 14,382 | 1.58% | 351 | 1.11% | 247 | -31.91% | -7,102 | 22,260 |
| Big Stone | 35.41% | 1,053 | 62.64% | 1,863 | 0.47% | 14 | 1.48% | 44 | -27.23% | -810 | 2,974 |
| Blue Earth | 50.84% | 18,330 | 46.41% | 16,731 | 1.32% | 477 | 1.42% | 513 | 4.43% | 1,599 | 36,051 |
| Brown | 32.48% | 4,753 | 65.27% | 9,552 | 0.93% | 136 | 1.33% | 194 | -32.79% | -4,799 | 14,635 |
| Carlton | 49.58% | 10,098 | 48.07% | 9,791 | 1.13% | 231 | 1.22% | 249 | 1.51% | 307 | 20,369 |
| Carver | 46.37% | 30,774 | 51.25% | 34,009 | 1.24% | 822 | 1.14% | 756 | -4.88% | -3,235 | 66,361 |
| Cass | 34.68% | 6,342 | 63.54% | 11,620 | 0.61% | 111 | 1.18% | 216 | -28.86% | -5,278 | 18,289 |
| Chippewa | 33.67% | 2,226 | 64.29% | 4,250 | 0.88% | 58 | 1.16% | 77 | -30.62% | -2,024 | 6,611 |
| Chisago | 34.15% | 11,806 | 63.40% | 21,916 | 1.34% | 464 | 1.11% | 384 | -29.25% | -10,110 | 34,570 |
| Clay | 50.74% | 16,357 | 46.66% | 15,043 | 1.27% | 410 | 1.33% | 429 | 4.08% | 1,314 | 32,239 |
| Clearwater | 26.76% | 1,260 | 71.62% | 3,372 | 0.59% | 28 | 1.02% | 48 | -44.86% | -2,112 | 4,708 |
| Cook | 65.58% | 2,496 | 31.61% | 1,203 | 0.95% | 36 | 1.86% | 71 | 33.97% | 1,293 | 3,806 |
| Cottonwood | 30.03% | 1,834 | 68.20% | 4,165 | 0.90% | 55 | 0.87% | 53 | -38.17% | -2,331 | 6,107 |
| Crow Wing | 34.17% | 13,726 | 63.91% | 25,676 | 0.89% | 357 | 1.03% | 414 | -29.74% | -11,950 | 40,173 |
| Dakota | 55.73% | 146,155 | 41.81% | 109,638 | 1.13% | 2,957 | 1.35% | 3,509 | 13.92% | 36,517 | 262,259 |
| Dodge | 33.47% | 4,079 | 63.86% | 7,783 | 1.37% | 167 | 1.30% | 158 | -30.39% | -3,704 | 12,187 |
| Douglas | 32.56% | 7,868 | 65.38% | 15,799 | 0.98% | 238 | 1.08% | 260 | -32.82% | -7,931 | 24,165 |
| Faribault | 31.98% | 2,531 | 65.59% | 5,191 | 0.91% | 72 | 1.52% | 120 | -33.61% | -2,660 | 7,914 |
| Fillmore | 37.48% | 4,551 | 60.14% | 7,301 | 1.11% | 135 | 1.27% | 154 | -22.66% | -2,750 | 12,141 |
| Freeborn | 40.96% | 6,889 | 56.95% | 9,578 | 0.87% | 146 | 1.21% | 205 | -15.99% | -2,689 | 16,818 |
| Goodhue | 41.23% | 11,806 | 56.06% | 16,052 | 1.39% | 397 | 1.33% | 381 | -14.83% | -4,246 | 28,636 |
| Grant | 35.58% | 1,300 | 62.10% | 2,269 | 1.18% | 43 | 1.14% | 42 | -26.52% | -969 | 3,654 |
| Hennepin | 70.46% | 532,623 | 27.25% | 205,973 | 1.00% | 7,526 | 1.30% | 9,847 | 43.21% | 326,650 | 755,969 |
| Houston | 42.42% | 4,853 | 55.37% | 6,334 | 1.00% | 114 | 1.21% | 139 | -12.95% | -1,481 | 11,440 |
| Hubbard | 34.42% | 4,462 | 63.26% | 8,202 | 1.03% | 134 | 1.29% | 167 | -28.84% | -3,740 | 12,965 |
| Isanti | 29.45% | 7,138 | 68.05% | 16,491 | 1.25% | 304 | 1.25% | 302 | -38.60% | -9,353 | 24,235 |
| Itasca | 40.61% | 10,786 | 57.37% | 15,239 | 0.93% | 247 | 1.09% | 289 | -16.76% | -4,453 | 26,561 |
| Jackson | 29.99% | 1,745 | 67.85% | 3,948 | 0.91% | 53 | 1.26% | 73 | -37.86% | -2,203 | 5,819 |
| Kanabec | 30.02% | 2,774 | 67.93% | 6,278 | 1.01% | 93 | 1.05% | 97 | -37.91% | -3,504 | 9,242 |
| Kandiyohi | 36.12% | 8,440 | 61.78% | 14,437 | 0.90% | 211 | 1.19% | 279 | -25.66% | -5,997 | 23,367 |
| Kittson | 38.12% | 1,006 | 58.58% | 1,546 | 1.67% | 44 | 1.63% | 43 | -20.46% | -540 | 2,639 |
| Koochiching | 38.41% | 2,659 | 59.68% | 4,131 | 0.87% | 60 | 1.04% | 72 | -21.27% | -1,472 | 6,922 |
| Lac qui Parle | 35.79% | 1,446 | 62.57% | 2,528 | 0.50% | 20 | 1.14% | 46 | -26.78% | -1,082 | 4,040 |
| Lake | 50.64% | 3,647 | 47.11% | 3,393 | 1.08% | 78 | 1.17% | 84 | 3.53% | 254 | 7,202 |
| Lake of the Woods | 27.87% | 671 | 70.76% | 1,704 | 0.91% | 22 | 0.46% | 11 | -42.89% | -1,033 | 2,408 |
| Le Sueur | 33.73% | 5,672 | 64.07% | 10,775 | 1.00% | 169 | 1.20% | 202 | -30.34% | -5,103 | 16,818 |
| Lincoln | 30.08% | 937 | 68.09% | 2,121 | 0.74% | 23 | 1.10% | 34 | -38.01% | -1,184 | 3,115 |
| Lyon | 35.94% | 4,634 | 61.89% | 7,979 | 1.09% | 140 | 1.09% | 140 | -25.95% | -3,345 | 12,893 |
| Mahnomen | 48.26% | 1,112 | 49.57% | 1,142 | 0.39% | 9 | 1.77% | 41 | -1.31% | -30 | 2,304 |
| Marshall | 25.33% | 1,295 | 72.78% | 3,721 | 0.72% | 37 | 1.17% | 60 | -47.45% | -2,426 | 5,113 |
| Martin | 30.22% | 3,305 | 67.94% | 7,480 | 0.89% | 98 | 1.14% | 126 | -37.72% | -4,175 | 11,009 |
| McLeod | 30.64% | 6,413 | 66.81% | 13,986 | 1.39% | 292 | 1.16% | 242 | -36.17% | -7,573 | 20,933 |
| Meeker | 28.58% | 3,867 | 69.18% | 9,359 | 0.90% | 122 | 1.33% | 181 | -40.60% | -5,492 | 13,529 |
| Mille Lacs | 29.98% | 4,404 | 67.75% | 9,952 | 1.23% | 181 | 1.03% | 152 | -37.77% | -5,548 | 14,689 |
| Morrison | 22.33% | 4,367 | 75.78% | 14,821 | 0.88% | 173 | 1.01% | 197 | -53.45% | -10,454 | 19,558 |
| Mower | 46.00% | 8,899 | 51.82% | 10,025 | 0.91% | 177 | 1.26% | 244 | -5.82% | -1,126 | 19,345 |
| Murray | 29.60% | 1,449 | 68.69% | 3,363 | 0.65% | 32 | 1.06% | 52 | -39.09% | -1,914 | 4,896 |
| Nicollet | 50.31% | 9,622 | 47.15% | 9,018 | 1.16% | 222 | 1.38% | 263 | 3.16% | 604 | 19,125 |
| Nobles | 33.65% | 2,933 | 64.26% | 5,600 | 0.68% | 59 | 1.41% | 123 | -30.61% | -2,667 | 8,715 |
| Norman | 40.80% | 1,404 | 56.76% | 1,953 | 0.90% | 31 | 1.54% | 53 | -15.96% | -549 | 3,441 |
| Olmsted | 54.16% | 49,491 | 43.43% | 39,692 | 1.18% | 1,078 | 1.23% | 1,124 | 10.73% | 9,799 | 91,385 |
| Otter Tail | 32.85% | 11,958 | 65.39% | 23,800 | 0.71% | 257 | 1.05% | 384 | -32.54% | -11,842 | 36,399 |
| Pennington | 35.29% | 2,568 | 62.28% | 4,532 | 1.42% | 103 | 1.02% | 74 | -26.99% | -1,964 | 7,277 |
| Pine | 33.87% | 5,419 | 64.10% | 10,256 | 1.05% | 168 | 0.99% | 158 | -30.23% | -4,837 | 16,001 |
| Pipestone | 26.44% | 1,306 | 71.92% | 3,553 | 0.51% | 25 | 1.13% | 56 | -45.48% | -2,247 | 4,940 |
| Polk | 34.88% | 5,439 | 63.26% | 9,865 | 0.79% | 123 | 1.07% | 167 | -28.38% | -4,426 | 15,594 |
| Pope | 35.27% | 2,477 | 62.90% | 4,417 | 0.80% | 56 | 1.03% | 72 | -27.63% | -1,940 | 7,022 |
| Ramsey | 71.50% | 211,620 | 26.14% | 77,376 | 0.97% | 2,865 | 1.39% | 4,116 | 45.36% | 134,244 | 295,977 |
| Red Lake | 31.47% | 691 | 66.21% | 1,454 | 0.82% | 18 | 1.50% | 33 | -34.74% | -763 | 2,196 |
| Redwood | 28.43% | 2,355 | 69.66% | 5,771 | 0.92% | 76 | 0.99% | 82 | -41.23% | -3,416 | 8,284 |
| Renville | 30.71% | 2,496 | 67.26% | 5,467 | 0.84% | 68 | 1.19% | 97 | -36.55% | -2,971 | 8,128 |
| Rice | 48.76% | 17,402 | 48.94% | 17,464 | 1.04% | 372 | 1.25% | 448 | -0.18% | -62 | 35,686 |
| Rock | 29.69% | 1,556 | 68.38% | 3,583 | 0.67% | 35 | 1.26% | 66 | -38.69% | -2,027 | 5,240 |
| Roseau | 25.98% | 2,188 | 72.02% | 6,065 | 0.96% | 81 | 1.03% | 87 | -46.04% | -3,877 | 8,421 |
| St. Louis | 56.64% | 67,704 | 41.01% | 49,017 | 1.16% | 1,388 | 1.19% | 1,422 | 15.63% | 18,687 | 119,531 |
| Scott | 45.52% | 40,040 | 52.15% | 45,872 | 1.19% | 1,048 | 1.14% | 1,005 | -6.63% | -5,832 | 87,965 |
| Sherburne | 32.48% | 18,065 | 65.13% | 36,222 | 1.32% | 734 | 1.07% | 591 | -32.65% | -18,157 | 55,612 |
| Sibley | 28.60% | 2,417 | 69.38% | 5,864 | 0.84% | 71 | 1.18% | 100 | -40.78% | -3,447 | 8,452 |
| Stearns | 37.58% | 31,879 | 60.07% | 50,959 | 1.22% | 1,036 | 1.13% | 961 | -22.49% | -19,080 | 84,835 |
| Steele | 37.47% | 7,917 | 59.90% | 12,656 | 1.32% | 278 | 1.32% | 277 | -22.43% | -4,739 | 21,128 |
| Stevens | 37.80% | 1,922 | 59.86% | 3,044 | 0.87% | 44 | 1.46% | 75 | -22.06% | -1,122 | 5,085 |
| Swift | 34.35% | 1,784 | 63.86% | 3,316 | 0.81% | 42 | 0.98% | 51 | -29.51% | -1,532 | 5,193 |
| Todd | 24.79% | 3,286 | 73.57% | 9,753 | 0.64% | 85 | 1.00% | 133 | -48.78% | -6,467 | 13,257 |
| Traverse | 35.46% | 661 | 62.88% | 1,172 | 0.64% | 12 | 1.02% | 19 | -27.42% | -511 | 1,864 |
| Wabasha | 35.78% | 4,696 | 62.13% | 8,153 | 1.01% | 133 | 1.07% | 141 | -26.35% | -3,457 | 13,123 |
| Wadena | 26.35% | 2,023 | 71.90% | 5,520 | 0.70% | 54 | 1.04% | 80 | -45.55% | -3,497 | 7,677 |
| Waseca | 33.65% | 3,496 | 63.76% | 6,624 | 1.18% | 123 | 1.40% | 146 | -30.11% | -3,128 | 10,389 |
| Washington | 53.46% | 89,165 | 44.23% | 73,764 | 1.14% | 1,895 | 1.18% | 1,962 | 9.23% | 15,401 | 166,786 |
| Watonwan | 38.20% | 1,987 | 59.66% | 3,103 | 0.54% | 28 | 1.60% | 83 | -21.46% | -1,116 | 5,201 |
| Wilkin | 29.91% | 1,026 | 67.87% | 2,328 | 1.20% | 41 | 1.02% | 35 | -37.96% | -1,302 | 3,430 |
| Winona | 49.07% | 13,333 | 48.68% | 13,227 | 1.00% | 272 | 1.25% | 341 | 0.39% | 106 | 27,173 |
| Wright | 34.49% | 28,430 | 63.05% | 51,973 | 1.20% | 992 | 1.25% | 1,031 | -28.56% | -23,543 | 82,426 |
| Yellow Medicine | 30.54% | 1,688 | 67.55% | 3,734 | 0.81% | 45 | 1.10% | 61 | -37.01% | -2,046 | 5,528 |


Counties that flipped from Republican to Democratic
- Blue Earth (largest municipality: Mankato)
- Clay (largest municipality: Moorhead)
- Nicollet (largest municipality: North Mankato)
- Winona (largest municipality: Winona)
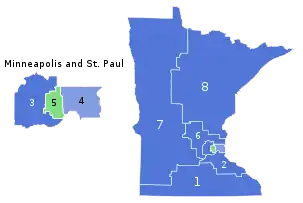
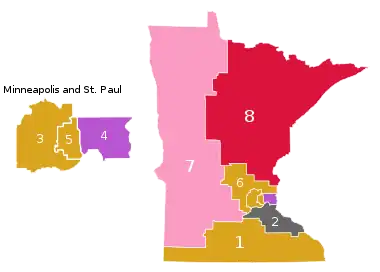
By congressional district
Biden and Trump each won 4 congressional districts.
| District | Biden | Trump | Representative |
|---|---|---|---|
| 1st | 43.9% | 54% | Jim Hagedorn |
| 2nd | 52.4% | 45.5% | Angie Craig |
| 3rd | 58.7% | 39.4% | Dean Phillips |
| 4th | 67.6% | 30.5% | Betty McCollum |
| 5th | 80.3% | 17.7% | Ilhan Omar |
| 6th | 38.8% | 58% | Tom Emmer |
| 7th | 34.4% | 63.8% | Collin Peterson |
| Michelle Fischbach | |||
| 8th | 41.7% | 56.3% | Pete Stauber |
Analysis
After narrowly losing the state in 2016, the Trump campaign targeted Minnesota believing it to be in play and seeing it as a chance to expand the political map. This did not pay off as polls of Minnesota voters throughout the campaign showed a clear Biden lead. Throughout the summer leading up to the election, the Twin Cities metro was the epicenter of the summer 2020 BLM protests, given that the murder of George Floyd had taken place in Minneapolis.
Trump attempted to court White suburban Minnesotans by using images of rioting and looting in some of his campaign ads and claiming that Biden would "destroy suburbia". These efforts failed, as Biden massively improved in the Twin Cities suburbs, leading to his solid statewide margin of victory. With victories in Hennepin and Ramsey counties, Biden became the first Democrat to win over 70% of the vote in any Minnesota county since former Senator from Minnesota and contemporary Vice President Hubert Humphrey in 1968.
Voter demographics
| Demographic subgroup | Biden | Trump | No Answer |
% of Voters |
|---|---|---|---|---|
| Party | ||||
| Democrat | 95 | 4 | N/A | 35 |
| Republican | 8 | 91 | N/A | 34 |
| Independent | 55 | 40 | N/A | 31 |
| Gender | ||||
| Men | 47 | 50 | 3 | 46 |
| Women | 58 | 41 | 1 | 54 |
| Race | ||||
| White | 51 | 47 | 2 | 87 |
| Black | 77 | 21 | 2 | 4 |
| Latino | 60 | 38 | 2 | 4 |
| Asian | N/A | N/A | N/A | 2 |
| Other | N/A | N/A | N/A | 3 |
| Gender by race/ethnicity | ||||
| White men | 44 | 53 | 3 | 45 |
| White women | 57 | 42 | 1 | 55 |
| Black men | 69 | 30 | 1 | 6 |
| Black women | N/A | N/A | N/A | 2 |
| Latino men (of any race) | N/A | N/A | N/A | 3 |
| Latino women (of any race) | 63 | 35 | 2 | 4 |
| All other races | N/A | N/A | N/A | 3 |
| Marital status | ||||
| Married | 49 | 50 | 1 | 59 |
| Not married | 58 | 39 | 3 | 41 |
| Age | ||||
| 18–24 years old | 66 | 29 | N/A | 8 |
| 25–29 years old | 64 | 30 | N/A | 6 |
| 30–39 years old | 54 | 43 | 3 | 15 |
| 40–49 years old | 52 | 47 | 1 | 13 |
| 50–64 years old | 51 | 48 | N/A | 29 |
| 65 and older | 48 | 51 | 1 | 30 |
| Sexual orientation | ||||
| LGBT | N/A | N/A | N/A | 5 |
| Heterosexual | 51 | 47 | 2 | 95 |
| Education | ||||
| College graduate | 65 | 34 | N/A | 43 |
| No college degree | 45 | 53 | 1 | 57 |
| Education by race/ethnicity | ||||
| White college graduates | 62 | 35 | 3 | 39 |
| White no college degree | 42 | 57 | N/A | 48 |
| Non-white college graduates | 73 | 25 | 3 | 4 |
| Non-white no college degree | 64 | 32 | 4 | 9 |
| Income | ||||
| Under $30,000 | 58 | 40 | 2 | 16 |
| $30,000–$49,999 | 55 | 39 | 6 | 19 |
| Over $200,000 | 58 | 42 | N/A | 9 |
| Racism in the U.S is | ||||
| The most important problem | 85 | 14 | 1 | 9 |
| An important problem | 62 | 35 | 3 | 65 |
| Area Type | ||||
| Urban | 68 | 29 | 1 | 44 |
| Suburban | 42 | 56 | 2 | 34 |
| Rural | 46 | 52 | 2 | 16 |
| Source: CNN[35] | ||||
See also
Notes
- Poll sponsored by Lewis' campaign
- Poll sponsored by Giffords, whose founder, Gabby Giffords, had endorsed Biden prior to the sampling period
- Partisan clients
- Candidate withdrew shortly before the primary when absentee voting had already begun.
- Candidate withdrew after the New Hampshire primary when absentee voting had already begun.
- Candidate withdrew during the first days of absentee voting.
- Candidate withdrew after in-person absentee voting started on January 17, 2020.
- Calculated by taking the difference of 100% and all other candidates combined.
- Key:
A – all adults
RV – registered voters
LV – likely voters
V – unclear - Overlapping sample with the previous SurveyMonkey/Axios poll, but more information available regarding sample size
- "Someone else" with 1%
- "Other candidate or write-in" with 1%
- "Someone else" with 2%
- "Not sure/Someone else/Undecided" with 3%
- "Some other candidate" with 5%
- West (B) with 3%; "Someone else" with 1%
- "Someone else" with 3%
- Additional data sourced from FiveThirtyEight
- "Another Third Party Candidate" and West (B) with 1%; would not vote with 0%
- "Some other candidate" with 3%
- "Refused" with 2%; Fuente (A), "Other" and West (B) with 1%; Pierce (I) with 0%; Kennedy (SWP) and La Riva (PSOL) with no voters
- "Another Third Party/Write-in" with 1%
- "Neither" with 1%; "Other" and would not vote with 0%
- Overlapping sample with the previous Morning Consult poll, but more information available regarding sample size
- "Someone else/third party" with 2%
- "Someone else" and would not vote with 0%
- Includes "Refused"
- "Some other candidate" with 4%
- "Another Party Candidate" with 1%
- Including voters who lean towards a given candidate
- "Another Party Candidate"
- "Other" with 5%; would not vote with 1%
- Including undecided voters who lean towards Trump
- Including undecided voters who lean towards Biden
- For Howard Schultz as independent
- Listed as "unsure/other/refused"
- Poll sponsored by the Alliance for a Better Minnesota
References
- State Canvassing Board Certifies Results of 2020 General Election The total number of voters was 3,292,997. That means 79.96 percent of eligible Minnesotans participated in the 2020 General Election. That is the highest percentage turnout since 1956, and the highest total number of voters ever.
- Kelly, Ben (August 13, 2018). "US elections key dates: When are the 2018 midterms and the 2020 presidential campaign?". The Independent. Archived from the original on August 2, 2018. Retrieved January 3, 2019.
- "Distribution of Electoral Votes". National Archives and Records Administration. Retrieved January 3, 2019.
- "Trump got more votes in Minnesota in 2020 than he did in 2016. But Biden got way more than Clinton did". MinnPost. November 4, 2020. Retrieved November 11, 2020.
- "Despite attention, Trump gained little ground on Iron Range". The Star Tribune. November 4, 2020. Retrieved November 11, 2020.
- "Minnesota Voter Surveys: How Different Groups Voted". The New York Times. November 3, 2020. ISSN 0362-4331. Retrieved November 9, 2020.
- "State Canvassing Board Certificate - 2020 Presidential Nomination Primary". Minnesota State Canvassing Board. Retrieved March 19, 2020.
- "Minnesota Republican Delegation 2020". The Green Papers. Retrieved March 19, 2020.
- Taylor, Kate (February 9, 2019). "Elizabeth Warren Formally Announces 2020 Presidential Bid in Lawrence, Mass". The New York Times. Retrieved February 10, 2019.
- Cillizza, Chris; Enten, Harry (September 13, 2018). "There's a new No. 1 among 2020 Democrats". CNN.
- Burke, Michael (November 25, 2018). "Klobuchar says she is still considering 2020 run". The Hill.
- Smith, Mitch; Lerer, Lisa (February 10, 2019). "Amy Klobuchar Enters 2020 Presidential Race". The New York Times. Retrieved February 10, 2019.
- Kiersz, Andy; Hickey, Walt (March 4, 2020). "Joe Biden wins Minnesota primary". Business Insider.
- "State Canvassing Board Certificate 2020 Presidential Nomination Primary". Minnesota. Office of the Minnesota Secretary of State. March 10, 2020. Archived from the original on March 29, 2020. Retrieved April 2, 2020.
- "Delegate Tracker". Associated Press. August 17, 2020. Retrieved November 24, 2022.
- "We had ranked choice voting for our caucus, but a lot of people are interested in our first choice vote totals. This is how it broke down statewide". Facebook. Libertarian Party of Minnesota. February 26, 2020.
- Galvan, Jill (February 26, 2020). "Libertarian 2020 Caucus Full Results by Jill Galvan". Libertarian Party of Minnesota. Retrieved February 29, 2020.
- "We had ranked choice voting for our caucus, but a lot of people are interested in our first choice vote totals. This is how it broke down statewide". February 26, 2020 – via Facebook.com.
- "2020 POTUS Race ratings" (PDF). The Cook Political Report. Retrieved May 21, 2019.
- "POTUS Ratings | Inside Elections". insideelections.com. Retrieved May 21, 2019.
- "Larry J. Sabato's Crystal Ball » 2020 President". crystalball.centerforpolitics.org. Retrieved May 21, 2019.
- "2020 Election Forecast". Politico. November 19, 2019.
- "Battle for White House". RCP. April 19, 2019.
- 2020 Bitecofer Model Electoral College Predictions Archived April 23, 2020, at the Wayback Machine, Niskanen Center, March 24, 2020, retrieved: April 19, 2020
- David Chalian; Terence Burlij (June 11, 2020). "Road to 270: CNN's debut Electoral College map for 2020". CNN. Retrieved June 16, 2020.
- "Forecasting the US elections". The Economist. Retrieved July 7, 2020.
- "2020 Election Battleground Tracker". CBS News. July 12, 2020. Retrieved July 13, 2020.
- "2020 Presidential Election Interactive Map". 270 to Win.
- "ABC News Race Ratings". CBS News. July 24, 2020. Retrieved July 24, 2020.
- Montanaro, Domenico (August 3, 2020). "2020 Electoral Map Ratings: Trump Slides, Biden Advantage Expands Over 270 Votes". NPR.org. Retrieved August 3, 2020.
- "Biden dominates the electoral map, but here's how the race could tighten". NBC News. August 6, 2020. Retrieved August 6, 2020.
- "2020 Election Forecast". FiveThirtyEight. August 12, 2020. Retrieved August 14, 2020.
- "State of Minnesota Canvassing Report" (PDF). Office of the Minnesota Secretary of State. November 25, 2020. Archived (PDF) from the original on November 25, 2020. Retrieved November 25, 2020.
- "Official List of Candidates". Minnesota Secretary of State. Retrieved September 17, 2020.
- "Georgia 2020 President exit polls". www.cnn.com. Retrieved December 14, 2020.
Further reading
- Summary: State Laws on Presidential Electors (PDF), Washington DC: National Association of Secretaries of State, August 2020,
Minnesota
- David Weigel; Lauren Tierney (September 13, 2020), "The five political states of Minnesota", Washingtonpost.com, archived from the original on October 4, 2020
External links
- Elections & Voting - Minnesota Secretary of State
- Government Documents Round Table of the American Library Association, "Minnesota", Voting & Elections Toolkits
- "Minnesota: Election Tools, Deadlines, Dates, Rules, and Links", Vote.org, Oakland, CA
- "League of Women Voters of Minnesota". (State affiliate of the U.S. League of Women Voters)
- Minnesota at Ballotpedia