2020 Missouri Senate election
The 2020 Missouri Senate elections were held on November 3, 2020, to elect the seventeen Missouri State Senators to the Missouri Senate. Half of the Senate's thirty-four seats are up for election every two years, with each Senator serving four-year terms.[1] The last time that these seats were up for election was the 2016 Missouri Senate election, and the next time that these seats will be up for election will be the 2024 Missouri Senate election.
| |||||||||||||||||||||||||||||||
17 of Missouri's 34 Senate seats in the Missouri Senate. | |||||||||||||||||||||||||||||||
|---|---|---|---|---|---|---|---|---|---|---|---|---|---|---|---|---|---|---|---|---|---|---|---|---|---|---|---|---|---|---|---|
| |||||||||||||||||||||||||||||||
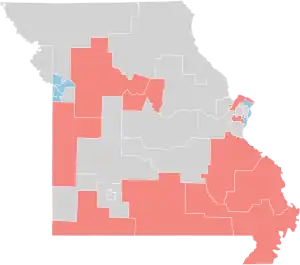 Results: Democratic hold Republican hold No election | |||||||||||||||||||||||||||||||
| |||||||||||||||||||||||||||||||
| Elections in Missouri |
|---|
 |
Predictions
| Source | Ranking | As of |
|---|---|---|
| The Cook Political Report[2] | Likely R | October 21, 2020 |
Results summary
Statewide
| Party | Candi- dates | Votes | Seats | ||||
|---|---|---|---|---|---|---|---|
| No. | % | No. | +/– | % | |||
| Republican Party | 14 | 731,386 | 53.38% | 10 | 58.82% | ||
| Democratic Party | 13 | 598,526 | 43.68% | 7 | 41.18% | ||
| Libertarian Party | 2 | 24,717 | 1.80% | 0 | 0.00% | ||
| Green Party | 1 | 15,383 | 1.12% | 0 | 0.00% | ||
| Write-Ins | 3 | 90 | 0.00% | 0 | 0.00% | ||
| Total | 29 | 1,370,102 | 100.00% | 17 | 100.00% | ||
District
Results of the 2020 Missouri State Senate elections by district:[3]
| District | Republican | Democratic | Others | Total | Result | ||||
|---|---|---|---|---|---|---|---|---|---|
| Votes | % | Votes | % | Votes | % | Votes | % | ||
| District 1 | 43,495 | 44.57% | 54,095 | 55.43% | - | - | 97,590 | 100.00% | Democratic Hold |
| District 3 | 65,686 | 100.00% | - | - | - | - | 65,686 | 100.00% | Republican Hold |
| District 5 | 8,349 | 12.90% | 56,379 | 87.10% | - | - | 64,728 | 100.00% | Democratic Hold |
| District 7 | - | - | 70,586 | 82.09% | 15,401 | 17.91% | 85,987 | 100.00% | Democratic Hold |
| District 9 | 11,026 | 17.64% | 51,463 | 82.36% | - | - | 62,489 | 100.00% | Democratic Hold |
| District 11 | - | - | 50,065 | 100.00% | - | - | 50,065 | 100.00% | Democratic Hold |
| District 13 | - | - | 64,191 | 87.56% | 9,122 | 12.44% | 73,313 | 100.00% | Democratic Hold |
| District 15 | 61,172 | 53.99% | 52,132 | 46.01% | - | - | 113,304 | 100.00% | Republican Hold |
| District 17 | 45,141 | 46.62% | 51,690 | 53.38% | - | - | 96,831 | 100.00% | Democratic Hold |
| District 19 | 50,570 | 51.60% | 47,367 | 48.33% | 72 | 0.07% | 98,009 | 100.00% | Republican Hold |
| District 21 | 61,698 | 79.82% | - | - | 15,595 | 20.17% | 77,293 | 100.00% | Republican Hold |
| District 23 | 57,988 | 57.25% | 43,306 | 42.75% | - | - | 101,294 | 100.00% | Republican Hold |
| District 25 | 58,215 | 100.00% | - | - | - | - | 58,215 | 100.00% | Republican Hold |
| District 27 | 63,644 | 76.88% | 19,135 | 23.12% | - | - | 82,779 | 100.00% | Republican Hold |
| District 29 | 75,582 | 100.00% | - | - | - | - | 75,582 | 100.00% | Republican Hold |
| District 31 | 63,929 | 71.42% | 25,584 | 28.58% | - | - | 89,513 | 100.00% | Republican Hold |
| District 33 | 64,891 | 83.81% | 12,533 | 16.19% | - | - | 77,424 | 100.00% | Republican Hold |
| Total | 731,386 | 53.38% | 598,526 | 43.68% | 40,190 | 2.93% | 1,370,102 | 100.00% | |
Close races
Districts where the margin of victory was under 10%:
- District 15, 7.98%
- District 17, 6.74%
- District 19, 3.27%
District 1
Primary Results
| Party | Candidate | Votes | % | |
|---|---|---|---|---|
| Democratic | Doug Beck | 26,601 | 100.0% | |
| Total votes | 26,601 | 100.0% | ||
Primary Results
| Party | Candidate | Votes | % | |
|---|---|---|---|---|
| Republican | David Lenihan | 7,299 | 66.1% | |
| Republican | Mitchell Kohlberg | 3,744 | 33.9% | |
| Total votes | 11,043 | 100.0% | ||
Results
| Party | Candidate | Votes | % | ±% | |
|---|---|---|---|---|---|
| Democratic | Doug Beck | 54,095 | 55.43% | +2.34% | |
| Republican | David Lenihan | 43,495 | 44.57% | -2.34% | |
| Margin of victory | 10,600 | 10.86% | |||
| Total votes | 97,590 | 100.0% | |||
| Democratic hold | |||||
District 3
Primary Results
| Party | Candidate | Votes | % | |
|---|---|---|---|---|
| Republican | Elaine Freeman Gannon | 10,646 | 42.09% | |
| Republican | Joshua Barrett | 9,211 | 36.41% | |
| Republican | Kent Scism | 5,437 | 21.50% | |
| Total votes | 25,294 | 100.0% | ||
Results
| Party | Candidate | Votes | % | ±% | |
|---|---|---|---|---|---|
| Republican | Elaine Freeman Gannon | 65,686 | 100% | +18.75% | |
| Margin of victory | 65,686 | 100% | |||
| Total votes | 65,686 | 100.0% | |||
| Republican hold | |||||
District 5
Primary Results
| Party | Candidate | Votes | % | |
|---|---|---|---|---|
| Democratic | Steve Roberts | 12,293 | 35.43% | |
| Democratic | Megan Ellyia Green | 11,241 | 32.40% | |
| Democratic | Michelle Sherod | 7,817 | 22.53% | |
| Democratic | William C. (Bill) Haas | 2,068 | 5.96% | |
| Democratic | Jeremiah Church | 893 | 2.57% | |
| Democratic | McFarlane E. Duncan | 387 | 1.11% | |
| Total votes | 35,688 | 100% | ||
Primary Results
| Party | Candidate | Votes | % | |
|---|---|---|---|---|
| Republican | Michael Hebron | 989 | 100% | |
| Total votes | 989 | 100% | ||
Results
| Party | Candidate | Votes | % | ±% | |
|---|---|---|---|---|---|
| Democratic | Steve Roberts | 56,379 | 87.10% | +1.80% | |
| Republican | Michael Hebron | 8,349 | 12.90% | -1.80% | |
| Margin of victory | 48,030 | 74.20% | |||
| Total votes | 64,728 | 100% | |||
| Democratic hold | |||||
District 7
Primary Results
| Party | Candidate | Votes | % | |
|---|---|---|---|---|
| Democratic | Greg Razer | 21,042 | 68.99% | |
| Democratic | Michael R. Brown | 9,456 | 31.01% | |
| Total votes | 30,498 | 100% | ||
Primary Results
| Party | Candidate | Votes | % | |
|---|---|---|---|---|
| Green | Nathan Kline | 46 | 100% | |
| Total votes | 46 | 100% | ||
Results
| Party | Candidate | Votes | % | ±% | |
|---|---|---|---|---|---|
| Democratic | Greg Razer | 70,586 | 82.09% | +2.86% | |
| Green | Nathan Kline | 15,383 | 17.89% | N/A | |
| N/A | Write-Ins | 18 | 0.02% | N/A | |
| Margin of victory | 55,203 | 64.20% | |||
| Total votes | 85,987 | 100% | |||
| Democratic hold | |||||
District 9
Primary Results
| Party | Candidate | Votes | % | |
|---|---|---|---|---|
| Democratic | Barbara Anne Washington | 17,937 | 88.27% | |
| Democratic | Ryan Myers | 2,383 | 11.73% | |
| Total votes | 20,320 | 100% | ||
Primary Results
| Party | Candidate | Votes | % | |
|---|---|---|---|---|
| Republican | David Martin | 2,637 | 100% | |
| Total votes | 2,637 | 100% | ||
Results
| Party | Candidate | Votes | % | ±% | |
|---|---|---|---|---|---|
| Democratic | Barbara Anne Washington | 51,463 | 82.36% | -17.64% | |
| Republican | David Martin | 11,026 | 17.64% | N/A | |
| Margin of victory | 40,437 | 64.72% | |||
| Total votes | 62,489 | 100% | |||
| Democratic hold | |||||
District 11
Primary Results
| Party | Candidate | Votes | % | |
|---|---|---|---|---|
| Democratic | John Joseph Rizzo (incumbent) | 12,012 | 100% | |
| Total votes | 12,012 | 100% | ||
Results
| Party | Candidate | Votes | % | ±% | |
|---|---|---|---|---|---|
| Democratic | John Joseph Rizzo (incumbent) | 50,065 | 100% | +47.83% | |
| Margin of victory | 50,065 | 100% | |||
| Total votes | 50,065 | 100% | |||
| Democratic hold | |||||
District 13
Primary Results
| Party | Candidate | Votes | % | |
|---|---|---|---|---|
| Democratic | Angela Walton Mosley | 13,580 | 41.21% | |
| Democratic | Tommie Pierson Jr | 13,219 | 40.11% | |
| Democratic | Alan (Al) Green | 6,156 | 18.68% | |
| Total votes | 32,955 | 100% | ||
Primary Results
| Party | Candidate | Votes | % | |
|---|---|---|---|---|
| Libertarian | Jeff Coleman | 83 | 100% | |
| Total votes | 83 | 100% | ||
Results
| Party | Candidate | Votes | % | ±% | |
|---|---|---|---|---|---|
| Democratic | Angela Walton Mosley | 64,191 | 87.56% | -12.44% | |
| Libertarian | Jeff Coleman | 9,122 | 12.44% | N/A | |
| Margin of victory | 55,069 | 75.12% | |||
| Total votes | 73,313 | 100% | |||
| Democratic hold | |||||
District 15
Primary Results
| Party | Candidate | Votes | % | |
|---|---|---|---|---|
| Democratic | Deb Lavender | 27,050 | 100% | |
| Total votes | 27,050 | 100% | ||
Primary Results
| Party | Candidate | Votes | % | |
|---|---|---|---|---|
| Republican | Andrew Koenig (incumbent) | 15,519 | 100% | |
| Total votes | 15,519 | 100% | ||
Results
| Party | Candidate | Votes | % | ±% | |
|---|---|---|---|---|---|
| Republican | Andrew Koenig (incumbent) | 61,172 | 53.99% | -7.04% | |
| Democratic | Deb Lavender | 52,132 | 46.01% | +7.07% | |
| Margin of victory | 9,040 | 7.98% | |||
| Total votes | 113,304 | 100% | |||
| Republican hold | |||||
District 17
Primary Results
| Party | Candidate | Votes | % | |
|---|---|---|---|---|
| Democratic | Lauren Arthur | 16,354 | 100% | |
| Total votes | 16,354 | 100% | ||
Primary Results
| Party | Candidate | Votes | % | |
|---|---|---|---|---|
| Republican | Mickey Younghanz | 12,634 | 100% | |
| Total votes | 12,634 | 100% | ||
Results
| Party | Candidate | Votes | % | ±% | |
|---|---|---|---|---|---|
| Democratic | Lauren Arthur | 51,690 | 53.38% | -7.88% | |
| Republican | Mickey Younghanz | 45,141 | 46.62% | +7.88% | |
| Margin of victory | 6,549 | 6.76% | |||
| Total votes | 96,831 | 100% | |||
| Democratic hold | |||||
District 19
Primary Results
| Party | Candidate | Votes | % | |
|---|---|---|---|---|
| Democratic | Judy Baker | 18,623 | 100% | |
| Total votes | 18,623 | 100% | ||
Primary Results
| Party | Candidate | Votes | % | |
|---|---|---|---|---|
| Republican | Caleb Rowden (incumbent) | 15,010 | 100% | |
| Total votes | 15,010 | 100% | ||
Results
| Party | Candidate | Votes | % | ±% | |
|---|---|---|---|---|---|
| Republican | Caleb Rowden (incumbent) | 50,570 | 51.60% | +0.39% | |
| Democratic | Judy Baker | 47,367 | 48.33% | -0.45% | |
| N/A | Write-Ins | 72 | 0.07% | N/A | |
| Margin of victory | 3,203 | 3.27% | |||
| Total votes | 98,009 | 100% | |||
| Republican hold | |||||
District 21
Primary Results
| Party | Candidate | Votes | % | |
|---|---|---|---|---|
| Republican | Denny Hoskins (incumbent) | 21,430 | 100% | |
| Total votes | 21,430 | 100% | ||
Primary Results
| Party | Candidate | Votes | % | |
|---|---|---|---|---|
| Libertarian | Mark Bliss | 151 | 100% | |
| Total votes | 151 | 100% | ||
Results
| Party | Candidate | Votes | % | ±% | |
|---|---|---|---|---|---|
| Republican | Denny Hoskins (incumbent) | 61,698 | 79.82% | +12.19% | |
| Libertarian | Mark Bliss | 15,595 | 20.18% | +14.70% | |
| Margin of victory | 46,103 | 59.64% | |||
| Total votes | 77,293 | 100% | |||
| Republican hold | |||||
District 23
Primary Results
| Party | Candidate | Votes | % | |
|---|---|---|---|---|
| Democratic | Richard Orr | 14,370 | 100% | |
| Total votes | 14,370 | 100% | ||
Primary Results
| Party | Candidate | Votes | % | |
|---|---|---|---|---|
| Republican | Bill Eigel (incumbent) | 15,018 | 71.29% | |
| Republican | Eric Wulff | 3,310 | 15.71% | |
| Republican | Dan O'Connell | 2,737 | 12.99% | |
| Total votes | 21,065 | 100% | ||
Results
| Party | Candidate | Votes | % | ±% | |
|---|---|---|---|---|---|
| Republican | Bill Eigel (incumbent) | 57,988 | 57.25% | -2.91% | |
| Democratic | Richard Orr | 43,306 | 42.75% | +6.10% | |
| Margin of victory | 14,682 | 14.50% | |||
| Total votes | 101,294 | 100% | |||
| Republican hold | |||||
District 25
Primary Results
| Party | Candidate | Votes | % | |
|---|---|---|---|---|
| Republican | Jason Bean | 12,791 | 46.18% | |
| Republican | Jeff Shawan | 5,765 | 20.81% | |
| Republican | Eddy Justice | 4,920 | 17.76% | |
| Republican | Stephen Carroll Cookson | 4,223 | 15.25% | |
| Total votes | 27,699 | 100% | ||
Results
| Party | Candidate | Votes | % | ±% | |
|---|---|---|---|---|---|
| Republican | Jason Bean | 58,215 | 100% | +30.65% | |
| Margin of victory | 58,215 | 100% | |||
| Total votes | 58,215 | 100% | |||
| Republican hold | |||||
District 27
Primary Results
| Party | Candidate | Votes | % | |
|---|---|---|---|---|
| Democratic | Donnie Owens | 4,176 | 100% | |
| Total votes | 4,176 | 100% | ||
Primary Results
| Party | Candidate | Votes | % | |
|---|---|---|---|---|
| Republican | Holly Rehder | 16,839 | 50.21% | |
| Republican | Kathy Swan | 16,698 | 49.79% | |
| Total votes | 33,537 | 100% | ||
Results
| Party | Candidate | Votes | % | ±% | |
|---|---|---|---|---|---|
| Republican | Holly Rehder | 63,644 | 76.88% | +2.44% | |
| Democratic | Donnie Owens | 19,135 | 23.12% | -2.44% | |
| Margin of victory | 44,509 | 53.76% | |||
| Total votes | 82,779 | 100% | |||
| Republican hold | |||||
District 29
Primary Results
| Party | Candidate | Votes | % | |
|---|---|---|---|---|
| Republican | Mike Moon | 17,781 | 52.49% | |
| Republican | David Cole | 16,093 | 47.51% | |
| Total votes | 33,874 | 100% | ||
Results
| Party | Candidate | Votes | % | ±% | |
|---|---|---|---|---|---|
| Republican | Mike Moon | 75,582 | 100% | ||
| Margin of victory | 75,582 | 100% | |||
| Total votes | 75,582 | 100% | |||
| Republican hold | |||||
District 31
Primary Results
| Party | Candidate | Votes | % | |
|---|---|---|---|---|
| Democratic | Raymond Kinney | 7,971 | 100% | |
| Total votes | 7,971 | 100% | ||
Primary Results
| Party | Candidate | Votes | % | |
|---|---|---|---|---|
| Republican | Rick Brattin | 14,012 | 49.59% | |
| Republican | Jack Bondon | 12,467 | 44.13% | |
| Republican | Bill Yarberry | 1,774 | 6.28% | |
| Total votes | 28,253 | 100% | ||
Results
| Party | Candidate | Votes | % | ±% | |
|---|---|---|---|---|---|
| Republican | Rick Brattin | 63,929 | 71.42% | -1.01% | |
| Democratic | Raymond Kinney | 25,584 | 28.58% | N/A | |
| Margin of victory | 38,345 | 42.84% | |||
| Total votes | 89,513 | 100% | |||
| Republican hold | |||||
District 33
Primary Results
| Party | Candidate | Votes | % | |
|---|---|---|---|---|
| Democratic | Tammy Harty | 3,274 | 100% | |
| Total votes | 3,274 | 100% | ||
Primary Results
| Party | Candidate | Votes | % | |
|---|---|---|---|---|
| Republican | Karla Eslinger | 12,704 | 37.12% | |
| Republican | Robert Ross | 12,562 | 36.71% | |
| Republican | Van Kelly | 8,958 | 26.17% | |
| Total votes | 34,224 | 100% | ||
Results
| Party | Candidate | Votes | % | ±% | |
|---|---|---|---|---|---|
| Republican | Karla Eslinger | 64,891 | 83.81% | -16.19% | |
| Democratic | Tammy Harty | 12,533 | 16.19% | N/A | |
| Margin of victory | 52,358 | 67.62% | |||
| Total votes | 77,424 | 100% | |||
| Republican hold | |||||
References
- "Missouri Election Results". The New York Times. November 3, 2020. Retrieved November 19, 2020.
- "October Overview: Handicapping the 2020 State Legislature Races". The Cook Political Report. Retrieved November 1, 2020.
- "Election Night Results". Missouri Secretary of State. Retrieved November 20, 2020.
- "State of Missouri - Primary Election, August 04, 2020" (PDF). Missouri Secretary of State. August 24, 2020.
- "State of Missouri - General Election, November 03, 2020". Missouri Secretary of State. December 8, 2020. Archived from the original on January 27, 2021. Retrieved February 17, 2021.
This article is issued from Wikipedia. The text is licensed under Creative Commons - Attribution - Sharealike. Additional terms may apply for the media files.