2023 Solihull Metropolitan Borough Council election
The 2023 Solihull Metropolitan Borough Council election took place on 4 May 2023 to elect members of the Solihull Metropolitan Borough Council in West Midlands, England.[1] This was on the same day as other local elections. There were 17 of the council's 51 seats up for election, being the usual third of the council.[2]
| |||||||||||||||||||||||||||||||||||||||||||||||||||||||||||||||||||||||
17 out of 51 seats to Solihull Metropolitan Borough Council 26 seats needed for a majority | |||||||||||||||||||||||||||||||||||||||||||||||||||||||||||||||||||||||
|---|---|---|---|---|---|---|---|---|---|---|---|---|---|---|---|---|---|---|---|---|---|---|---|---|---|---|---|---|---|---|---|---|---|---|---|---|---|---|---|---|---|---|---|---|---|---|---|---|---|---|---|---|---|---|---|---|---|---|---|---|---|---|---|---|---|---|---|---|---|---|---|
| |||||||||||||||||||||||||||||||||||||||||||||||||||||||||||||||||||||||
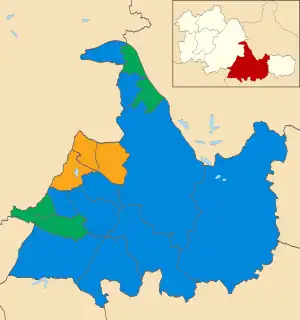 Winner of each seat at the 2023 Solihull Metropolitan Borough Council election | |||||||||||||||||||||||||||||||||||||||||||||||||||||||||||||||||||||||
| |||||||||||||||||||||||||||||||||||||||||||||||||||||||||||||||||||||||
The Conservatives retained their majority on the council. Solihull went against the national trend in this election; in most councils the Conservatives lost seats, whereas in Solihull they gained two extra seats.[3][4][5]
Overall results
The overall results were:[6][7][8]
| 2023 Solihull Metropolitan Borough Council election | ||||||||||
|---|---|---|---|---|---|---|---|---|---|---|
| Party | This election | Full council | This election | |||||||
| Seats | Net | Seats % | Other | Total | Total % | Votes | Votes % | +/− | ||
| Conservative | 10 | 58.8 | 19 | 29 | 56.9 | 22,078 | 38.4 | |||
| Green | 4 | 23.5 | 9 | 13 | 25.5 | 17,138 | 29.8 | |||
| Liberal Democrats | 3 | 17.6 | 3 | 6 | 11.8 | 9,259 | 16.1 | |||
| Independent | 0 | 0.0 | 2 | 2 | 3.9 | 367 | 0.6 | |||
| Labour | 0 | 0.0 | 0 | 0 | 0.0 | 8,553 | 14.9 | |||
| TUSC | 0 | 0.0 | 0 | 0 | 0.0 | 48 | 0.1 | |||
Ward results
The results for each ward were:[3]
Bickenhill
| Party | Candidate | Votes | % | ±% | |
|---|---|---|---|---|---|
| Conservative | Bob Sleigh* | 1,479 | 59.3 | ||
| Labour | Margaret Brittin | 551 | 22.1 | ||
| Green | Mark Pearson | 299 | 12.0 | ||
| Liberal Democrats | Kate Jones | 165 | 6.6 | ||
| Majority | 928 | 37.2 | |||
| Conservative hold | Swing | ||||
Blythe
| Party | Candidate | Votes | % | ±% | |
|---|---|---|---|---|---|
| Conservative | Ken Hawkins* | 1,947 | 55.7 | ||
| Labour | McKenzie Uruakpa | 679 | 19.4 | ||
| Green | Carol Linfield | 354 | 10.1 | ||
| Liberal Democrats | John Wyatt | 314 | 9.0 | ||
| Independent | Peter Bulcock | 200 | 5.7 | ||
| Majority | 1,268 | 36.3 | |||
| Conservative hold | Swing | ||||
Castle Bromwich
| Party | Candidate | Votes | % | ±% | |
|---|---|---|---|---|---|
| Conservative | Leslie Kaye | 1,400 | 59.0 | ||
| Labour | Emma Chidler | 505 | 21.3 | ||
| Green | Srikanth Pathuri | 467 | 19.7 | ||
| Majority | 895 | 37.7 | N/A | ||
| Conservative gain from Green | Swing | ||||
Chelmsley Wood
| Party | Candidate | Votes | % | ±% | |
|---|---|---|---|---|---|
| Green | Jane Lamden | 898 | 64.8 | ||
| Labour Co-op | Hazel Dawkins | 330 | 23.8 | ||
| Conservative | David Bell | 137 | 9.9 | ||
| Liberal Democrats | Jamshid Moori | 21 | 1.5 | ||
| Majority | 568 | 41.0 | |||
| Green hold | Swing | ||||
Dorridge & Hockley Heath
| Party | Candidate | Votes | % | ±% | |
|---|---|---|---|---|---|
| Conservative | Andy Mackiewicz* | 1,956 | 58.0 | ||
| Green | Jane Holt | 563 | 16.7 | ||
| Labour | Laura Attwell | 479 | 14.2 | ||
| Liberal Democrats | David Godfrey | 376 | 11.1 | ||
| Majority | 1,393 | 41.3 | |||
| Conservative hold | Swing | ||||
Elmdon
| Party | Candidate | Votes | % | ±% | |
|---|---|---|---|---|---|
| Liberal Democrats | Richard Long | 1,443 | 53.0 | ||
| Conservative | Catherine Price | 911 | 33.5 | ||
| Labour | Lisa Holcroft | 369 | 13.6 | ||
| Majority | 532 | 19.5 | |||
| Liberal Democrats hold | Swing | ||||
Kingshurst & Fordbridge
| Party | Candidate | Votes | % | ±% | |
|---|---|---|---|---|---|
| Conservative | David Cole | 584 | 36.6 | ||
| Green | Paul Sultana | 542 | 33.9 | ||
| Labour | Jackie Moore | 387 | 24.2 | ||
| Independent | Jo Cole | 84 | 5.3 | ||
| Majority | 42 | 2.6 | N/A | ||
| Conservative gain from Labour | Swing | ||||
The previous incumbent, Marcus Brain, had been elected as a Labour councillor in 2019 but defected to the Greens in 2021.[9]
Knowle
| Party | Candidate | Votes | % | ±% | |
|---|---|---|---|---|---|
| Conservative | Edward Fitter | 1,989 | 60.0 | ||
| Labour | Simon Johnson | 444 | 13.4 | ||
| Green | Mark Amphlett | 443 | 13.4 | ||
| Liberal Democrats | Lionel King | 438 | 13.2 | ||
| Majority | 1,545 | 46.6 | N/A | ||
| Conservative gain from Independent | Swing | ||||
Lyndon
| Party | Candidate | Votes | % | ±% | |
|---|---|---|---|---|---|
| Liberal Democrats | Kathryn Thomas* | 1,684 | 57.7 | ||
| Conservative | Keith Green | 711 | 24.4 | ||
| Labour Co-op | Sheila Brookes | 474 | 16.2 | ||
| TUSC | Lynsey Fraser-Smith | 48 | 1.6 | ||
| Majority | 973 | 33.4 | |||
| Liberal Democrats hold | Swing | ||||
Meriden
| Party | Candidate | Votes | % | ±% | |
|---|---|---|---|---|---|
| Conservative | Heather Delaney | 1,934 | 56.7 | ||
| Green | Antony Lowe | 664 | 19.5 | ||
| Labour | Cathy Connan | 520 | 15.2 | ||
| Liberal Democrats | Frank Dawson | 292 | 8.6 | ||
| Majority | 1,270 | 37.2 | |||
| Conservative hold | Swing | ||||
Olton
| Party | Candidate | Votes | % | ±% | |
|---|---|---|---|---|---|
| Liberal Democrats | James Bradley | 1,771 | 46.6 | ||
| Conservative | Bob Grinsell* | 1,548 | 40.8 | ||
| Labour | Antony Oseland | 395 | 10.4 | ||
| Independent | Nick Nick | 83 | 2.2 | ||
| Majority | 223 | 5.9 | N/A | ||
| Liberal Democrats gain from Conservative | Swing | ||||
Shirley East
| Party | Candidate | Votes | % | ±% | |
|---|---|---|---|---|---|
| Conservative | Mark Parker* | 1,612 | 51.0 | ||
| Labour | Gerard Dufficy | 835 | 26.4 | ||
| Liberal Democrats | Gayle Monk | 470 | 14.9 | ||
| Green | Atin Kog | 246 | 7.8 | ||
| Majority | 777 | 24.6 | |||
| Conservative hold | Swing | ||||
Shirley South
| Party | Candidate | Votes | % | ±% | |
|---|---|---|---|---|---|
| Green | Shahin Ashraf* | 1,685 | 52.4 | ||
| Conservative | Howard Nicholas | 1,055 | 32.8 | ||
| Labour | Shirley Young | 478 | 14.9 | ||
| Majority | 630 | 19.6 | |||
| Green hold | Swing | ||||
Shirley West
| Party | Candidate | Votes | % | ±% | |
|---|---|---|---|---|---|
| Green | Oli Farr | 1,283 | 43.7 | ||
| Conservative | Lachhman Bhambra | 837 | 28.5 | ||
| Labour | Sarah Alan | 609 | 20.8 | ||
| Liberal Democrats | Christopher Johnson | 205 | 7.0 | ||
| Majority | 446 | 15.2 | |||
| Green hold | Swing | ||||
The previous incumbent in this Shirley West seat, Rosi Sexton, had been elected as a Green councillor in 2019, but left the party in 2022 and served the remainder of her term as an independent.[10]
Silhill
| Party | Candidate | Votes | % | ±% | |
|---|---|---|---|---|---|
| Conservative | Wazma Qais* | 1,660 | 49.0 | ||
| Liberal Democrats | Paul McCabe | 790 | 23.3 | ||
| Labour Co-op | Nick Stephens | 661 | 19.5 | ||
| Green | Trevor Barker | 277 | 8.2 | ||
| Majority | 870 | 25.7 | |||
| Conservative hold | Swing | ||||
Smith's Wood
| Party | Candidate | Votes | % | ±% | |
|---|---|---|---|---|---|
| Green | Mark Wilson* | 848 | 64.8 | ||
| Labour | Lydia Turner | 280 | 21.4 | ||
| Conservative | Sarah Young | 180 | 13.8 | ||
| Majority | 568 | 43.4 | |||
| Green hold | Swing | ||||
St. Alphege
| Party | Candidate | Votes | % | ±% | |
|---|---|---|---|---|---|
| Conservative | Sardul Marwa | 2,138 | 53.7 | ||
| Liberal Democrats | Mark Geary | 1,290 | 32.4 | ||
| Labour | Ian English | 557 | 14.0 | ||
| Majority | 848 | 21.3 | |||
| Conservative hold | Swing | ||||
References
- "Notice of Election" (PDF). Solihull Metropolitan Borough Council. 22 March 2023. Retrieved 25 April 2023.
- "The Borough of Solihull (Electoral Changes) Order 2003", legislation.gov.uk, The National Archives, SI 2003/2508, retrieved 16 May 2023
- Cramp, Thomas (5 May 2023). "Solihull election full results 2023 as Tories will look "harder at potholes"". Birmingham Mail. Retrieved 16 May 2023.
- Cramp, Thomas; DeSouza, Naomi (5 May 2023). "Solihull local election results Tories tighten grip on borough and buck national trend". Birmingham Live. Retrieved 16 May 2023.
- Cramp, Thomas (17 May 2023). "Council leader re-elected in Solihull as new mayor presides over borough". Birmingham Mail. Retrieved 15 June 2023.
- "2023 Election Results". Solihull Metropolitan Borough Council. Retrieved 16 May 2023.
- "Solihull election result". BBC News. Retrieved 16 May 2023.
- "Local elections 2023: full council results for England". The Guardian. 9 May 2023. Retrieved 16 May 2023.
- Crawford, Ross (2 November 2021). "'A difficult decision' as stalwart quits Labour to join Greens". Solihull Observer. Retrieved 16 May 2023.
- Boothroyd, David (18 February 2022). "Take a seat from the Lib Dems, Darling". Local Councils. Retrieved 17 May 2023.
| Birmingham | |
|---|---|
| Coventry | |
| Dudley | |
| Sandwell | |
| Solihull | |
| Walsall | |
| Wolverhampton | |
| West Midlands County Council |
|
| Mayor | |
| |