2023 Winchester City Council election
The 2023 Winchester City Council election took place on 4 May 2023 to elect members of Winchester City Council in Hampshire, England.[2] This was on the same day as other local elections in England.
| ||||||||||||||||||||||||||||||||||||||||||||||||||||||||||||||||||||
16 out of 45 seats to Winchester City Council 23 seats needed for a majority | ||||||||||||||||||||||||||||||||||||||||||||||||||||||||||||||||||||
|---|---|---|---|---|---|---|---|---|---|---|---|---|---|---|---|---|---|---|---|---|---|---|---|---|---|---|---|---|---|---|---|---|---|---|---|---|---|---|---|---|---|---|---|---|---|---|---|---|---|---|---|---|---|---|---|---|---|---|---|---|---|---|---|---|---|---|---|---|
| ||||||||||||||||||||||||||||||||||||||||||||||||||||||||||||||||||||
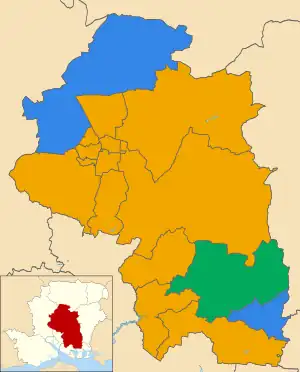 Winner of each seat at the 2023 Winchester City Council election | ||||||||||||||||||||||||||||||||||||||||||||||||||||||||||||||||||||
| ||||||||||||||||||||||||||||||||||||||||||||||||||||||||||||||||||||
The council was under Liberal Democrat majority control prior to the election. They increased their majority on the council at the election.[3][4]
Summary
Election result
| 2023 Winchester City Council election | ||||||||||
|---|---|---|---|---|---|---|---|---|---|---|
| Party | This election | Full council | This election | |||||||
| Seats | Net | Seats % | Other | Total | Total % | Votes | Votes % | +/− | ||
| Liberal Democrats | 13 | 81.3 | 17 | 30 | 66.7 | 20,672 | 50.1 | +4.3 | ||
| Conservative | 2 | 12.5 | 10 | 12 | 26.7 | 13,290 | 32.2 | –5.9 | ||
| Green | 1 | 6.3 | 1 | 2 | 4.4 | 5,224 | 12.7 | +2.3 | ||
| Independent | 0 | 0.0 | 1 | 1 | 2.2 | N/A | N/A | –0.7 | ||
| Labour | 0 | 0.0 | 0 | 0 | 0.0 | 2,018 | 4.9 | –0.2 | ||
| Reform UK | 0 | 0.0 | 0 | 0 | 0.0 | 84 | 0.2 | N/A | ||
Candidates
The Statement of Persons Nominated, which details the candidates standing in each ward, was released by Winchester City Council following the close of nominations on 5 April 2023. The results for each ward were as follows:[5]
Alresford & Itchen Valley
| Party | Candidate | Votes | % | ±% | |
|---|---|---|---|---|---|
| Liberal Democrats | Russell Gordon-Smith* | 2,034 | 58.80 | -2.78 | |
| Conservative | Harry Johnson-Hill | 1,187 | 34.32 | +4.03 | |
| Green | Richard Needham | 164 | 4.74 | -1.91 | |
| Labour | Tessa Valentine | 74 | 2.14 | +0.67 | |
| Majority | |||||
| Turnout | |||||
| Registered electors | |||||
| Liberal Democrats hold | Swing | ||||
Badger Farm & Oliver's Battery
| Party | Candidate | Votes | % | ±% | |
|---|---|---|---|---|---|
| Liberal Democrats | Adrian Brophy | 1,769 | 50.66 | -0.05 | |
| Conservative | Michael Killeen | 1,350 | 38.66 | -2.67 | |
| Green | Max Priesemann | 193 | 5.53 | +0.32 | |
| Labour | Adrian Field | 96 | 2.75 | +0.27 | |
| Reform UK | Lincoln Redding | 84 | 2.41 | NEW | |
| Majority | |||||
| Turnout | |||||
| Registered electors | |||||
| Liberal Democrats hold | Swing | ||||
Bishops Waltham
| Party | Candidate | Votes | % | ±% | |
|---|---|---|---|---|---|
| Liberal Democrats | Jonathan Williams | 1,618 | 54.20 | +18.61 | |
| Conservative | Donald Iro | 1,022 | 34.24 | -12.66 | |
| Green | Richard Cannon | 232 | 7.77 | -3.47 | |
| Labour | Steve Haines | 113 | 3.79 | -2.49 | |
| Majority | |||||
| Turnout | |||||
| Registered electors | |||||
| Liberal Democrats gain from Conservative | Swing | ||||
Central Meon Valley
| Party | Candidate | Votes | % | ±% | |
|---|---|---|---|---|---|
| Green | Danny Lee | 2,168 | 63.10 | +7.61 | |
| Conservative | Kris Ford | 889 | 25.87 | -8.27 | |
| Liberal Democrats | Tom Gregory | 313 | 9.11 | +0.77 | |
| Labour | Antony McNally | 66 | 1.92 | -0.08 | |
| Majority | |||||
| Turnout | |||||
| Registered electors | |||||
| Green gain from Independent | Swing | ||||
Colden Common & Twyford
| Party | Candidate | Votes | % | ±% | |
|---|---|---|---|---|---|
| Liberal Democrats | Hannah Greenberg | 1,247 | 61.82 | +25.34 | |
| Conservative | Paula Johnston | 555 | 27.52 | -26.80 | |
| Green | Lucinda Graham | 137 | 6.79 | NEW | |
| Labour | Callum Hunter | 78 | 3.87 | -5.33 | |
| Majority | |||||
| Turnout | |||||
| Registered electors | |||||
| Liberal Democrats hold | Swing | ||||
Denmead
| Party | Candidate | Votes | % | ±% | |
|---|---|---|---|---|---|
| Conservative | Paula Langford-Smith | 1,035 | 44.90 | -6.94 | |
| Liberal Democrats | Michael Bennett | 954 | 41.39 | +9.53 | |
| Green | Beata Parry | 167 | 7.25 | -2.05 | |
| Labour | David Picton-Jones | 149 | 6.46 | -0.55 | |
| Majority | |||||
| Turnout | |||||
| Registered electors | |||||
| Conservative gain from Independent | Swing | ||||
Southwick & Wickham
| Party | Candidate | Votes | % | ±% | |
|---|---|---|---|---|---|
| Liberal Democrats | Chris Chamberlain | 936 | 55.35 | +8.08 | |
| Conservative | Sandy Phillips-Lee | 526 | 31.11 | +2.91 | |
| Green | Nigel Prior | 158 | 9.34 | +3.37 | |
| Labour | Paul Sony | 71 | 4.20 | -0.25 | |
| Majority | |||||
| Turnout | |||||
| Registered electors | |||||
| Liberal Democrats hold | Swing | ||||
St. Barnabas
| Party | Candidate | Votes | % | ±% | |
|---|---|---|---|---|---|
| Liberal Democrats | Jonny Morris | 1,933 | 58.74 | +4.08 | |
| Conservative | David Crudgington | 885 | 26.89 | -8.70 | |
| Green | Lorraine Abraham | 282 | 8.57 | +3.69 | |
| Labour | Lucy Sims | 191 | 5.80 | +0.92 | |
| Majority | |||||
| Turnout | |||||
| Registered electors | |||||
| Liberal Democrats hold | Swing | ||||
St. Bartholomew
| Party | Candidate | Votes | % | ±% | |
|---|---|---|---|---|---|
| Liberal Democrats | Nathan Eve | 1,352 | 56.55 | +0.30 | |
| Conservative | Samuel Feltham | 509 | 21.29 | -3.20 | |
| Green | Charlotte Harley | 284 | 11.88 | +2.21 | |
| Labour | Patrick Davies | 246 | 10.29 | +0.69 | |
| Majority | |||||
| Turnout | |||||
| Registered electors | |||||
| Liberal Democrats hold | Swing | ||||
St. Luke
| Party | Candidate | Votes | % | ±% | |
|---|---|---|---|---|---|
| Liberal Democrats | Charlie Wise | 669 | 55.33 | +22.79 | |
| Conservative | Ian Tait | 316 | 26.14 | -25.05 | |
| Labour | Alison Cochrane | 163 | 13.48 | +3.33 | |
| Green | Reece Chadwick | 61 | 5.05 | -1.07 | |
| Majority | |||||
| Turnout | |||||
| Registered electors | |||||
| Liberal Democrats hold | Swing | ||||
St. Michael
| Party | Candidate | Votes | % | ±% | |
|---|---|---|---|---|---|
| Liberal Democrats | George Prest | 1,601 | 55.49 | +4.13 | |
| Conservative | Fiona Mather | 832 | 28.84 | -3.94 | |
| Green | Kate Needham | 271 | 9.39 | +0.41 | |
| Labour | Peter Marsh | 181 | 6.27 | -0.62 | |
| Majority | |||||
| Turnout | |||||
| Registered electors | |||||
| Liberal Democrats hold | Swing | ||||
St. Paul
| Party | Candidate | Votes | % | ±% | |
|---|---|---|---|---|---|
| Liberal Democrats | Martin Tod* | 1,608 | 58.49 | -3.89 | |
| Conservative | Leo Keay | 533 | 19.39 | -1.28 | |
| Green | Giles Gooding | 376 | 13.68 | +343 | |
| Labour | Stephen Turner | 232 | 8.44 | +1.74 | |
| Majority | |||||
| Turnout | |||||
| Registered electors | |||||
| Liberal Democrats hold | Swing | ||||
The Worthys
| Party | Candidate | Votes | % | ±% | |
|---|---|---|---|---|---|
| Liberal Democrats | Jane Rutter* | 1,331 | 58.61 | +1.15 | |
| Conservative | Signe Biddle | 702 | 30.91 | -6.36 | |
| Labour | Hannah Dawson | 139 | 6.12 | +0.81 | |
| Green | Andrew Pogson | 99 | 4.36 | NEW | |
| Majority | |||||
| Turnout | |||||
| Registered electors | |||||
| Liberal Democrats hold | Swing | ||||
Upper Meon Valley
| Party | Candidate | Votes | % | ±% | |
|---|---|---|---|---|---|
| Liberal Democrats | Jerry Pett | 932 | 41.31 | +8.58 | |
| Conservative | Astrea Hurlock | 922 | 40.87 | -15.59 | |
| Green | Polly Perry | 352 | 15.60 | +7.74 | |
| Labour | Cameron Hodgkinson | 50 | 2.22 | -0.78 | |
| Majority | |||||
| Turnout | |||||
| Registered electors | |||||
| Liberal Democrats gain from Conservative | Swing | ||||
Whiteley & Shedfield
| Party | Candidate | Votes | % | ±% | |
|---|---|---|---|---|---|
| Liberal Democrats | Sudhakar Achwal | 1,286 | 64.11 | +6.09 | |
| Conservative | Tom Garth | 536 | 26.72 | -9.13 | |
| Green | Nicholas John | 96 | 4.79 | NEW | |
| Labour | Alison Ridley | 88 | 4.39 | -1.73 | |
| Majority | |||||
| Turnout | |||||
| Registered electors | |||||
| Liberal Democrats hold | Swing | ||||
Wonston & Micheldever
| Party | Candidate | Votes | % | ±% | |
|---|---|---|---|---|---|
| Conservative | Caroline Horrill* | 1,491 | 52.41 | -0.05 | |
| Liberal Democrats | Andrew Adams | 1,089 | 38.28 | +2.87 | |
| Green | Julia Stolle | 184 | 6.47 | -0.17 | |
| Labour | Antony de Peyer | 81 | 2.85 | -2.62 | |
| Majority | |||||
| Turnout | |||||
| Registered electors | |||||
| Conservative hold | Swing | ||||
References
- "Your councillors". Winchester City Council. Retrieved 3 May 2023.
- "Winchester City Council District & Parish Election (Thursday 4 May 2023)". Winchester City Council. Retrieved 23 April 2023.
- "Local Elections 2023: Results in Dorset, Hampshire and Wiltshire". ITV News. 5 May 2023. Retrieved 25 September 2023.
- Atkinson, Christopher (5 May 2023). "Winchester City Council elections 2023 - full results". Hampshire Chronicle. Retrieved 25 September 2023.
- "Election results". Winchester City Council. Retrieved 25 September 2023.
This article is issued from Wikipedia. The text is licensed under Creative Commons - Attribution - Sharealike. Additional terms may apply for the media files.