2023 Chichester District Council election
Elections to Chichester District Council in West Sussex, United Kingdom were held on 4 May 2023. The election took place on the same day as other local elections.
| ||||||||||||||||
All 36 seats to Chichester District Council 19 seats needed for a majority | ||||||||||||||||
|---|---|---|---|---|---|---|---|---|---|---|---|---|---|---|---|---|
| ||||||||||||||||
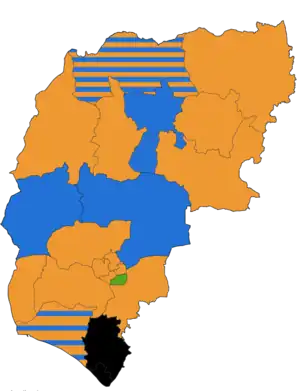 Map showing the results of the 2023 Chichester District Council elections by ward. | ||||||||||||||||
| ||||||||||||||||
The whole council was up for election, having previously been under no overall control and led by a Conservative minority administration.[1] The Liberal Democrats won 25 seats, the first time that the party (or any other than the Conservative Party) secured a majority on Chichester District Council.[2]
Summary
Election result
| 2023 Chichester District Council election[2] | ||||||||||
|---|---|---|---|---|---|---|---|---|---|---|
| Party | Candidates | Seats | Gains | Losses | Net gain/loss | Seats % | Votes % | Votes | +/− | |
| Liberal Democrats | 32 | 25 | 14 | 0 | ||||||
| Conservative | 36 | 5 | 0 | 13 | ||||||
| Local Alliance | 4 | 4 | 2 | 0 | ||||||
| Green | 12 | 2 | 0 | 0 | ||||||
| Labour | 17 | 0 | 0 | 2 | ||||||
| Reform UK | 2 | 0 | 0 | 0 | ||||||
| Independent | 2 | 0 | 0 | 1 | ||||||
| 25 | 5 | 4 | 2 |
| Liberal Democrats | Conservative | LA | Green |
Ward results
Chichester Central
| Party | Candidate | Votes | % | ±% | |
|---|---|---|---|---|---|
| Liberal Democrats | James Vivian | 404 | 46.0 | ||
| Conservative | Nicholas Roberts | 275 | 31.3 | ||
| Labour | James Field | 107 | 12.2 | ||
| Green | Mark Record | 92 | 10.5 | ||
| Majority | 129 | 14.7 | N/A | ||
| Turnout | 889 | 41.3 | |||
| Liberal Democrats gain from Conservative | Swing | ||||
Chichester East
| Party | Candidate | Votes | % | ±% | |
|---|---|---|---|---|---|
| Liberal Democrats | Bill Brisbane | 705 | 58.8 | ||
| Liberal Democrats | Rhys Chant | 613 | 51.1 | ||
| Labour | James Sandbach | 353 | 29.5 | ||
| Labour | Clare Walsh | 348 | 29.0 | ||
| Conservative | Peter Beveridge | 286 | 23.9 | ||
| Patria | Andrew Emerson | 92 | 7.7 | ||
| Majority | 352 | 29.4 | N/A | ||
| Majority | 265 | 22.1 | N/A | ||
| Turnout | 30.9 | ||||
| Liberal Democrats gain from Labour | Swing | ||||
| Liberal Democrats gain from Labour | Swing | ||||
Chichester North
| Party | Candidate | Votes | % | ±% | |
|---|---|---|---|---|---|
| Liberal Democrats | Jonathan Brown | 1,280 | 67.6 | ||
| Liberal Democrats | Maureen Corfield | 1,255 | 66.3 | ||
| Conservative | Alison Griffiths | 462 | 24.4 | ||
| Conservative | Giles Thompson | 448 | 23.7 | ||
| Labour | Olivia Connolly | 280 | 14.8 | ||
| Heritage | Teri Grieve | 68 | 3.6 | ||
| Majority | 818 | 43.2 | |||
| Majority | 807 | 42.6 | N/A | ||
| Turnout | 44.3 | ||||
| Liberal Democrats hold | Swing | ||||
| Liberal Democrats gain from Conservative | Swing | ||||
Chichester South
| Party | Candidate | Votes | % | ±% | |
|---|---|---|---|---|---|
| Green | Sarah Sharp | 1,287 | 83.6 | ||
| Green | Tim Young | 943 | 61.2 | ||
| Liberal Democrats | Joanne Kondabeka | 303 | 19.7 | ||
| Labour | Gareth Hitchman | 281 | 18.2 | ||
| Conservative | Simon Bailey | 266 | 17.3 | ||
| Majority | 984 | 63.9 | |||
| Majority | 662 | 43.0 | |||
| Turnout | 34.2 | ||||
| Green hold | Swing | ||||
| Green hold | Swing | ||||
Chichester West
| Party | Candidate | Votes | % | ±% | |
|---|---|---|---|---|---|
| Liberal Democrats | Clare Apel | 1,554 | 71.1 | ||
| Liberal Democrats | Sarah Quail | 1,403 | 64.2 | ||
| Conservative | Simon Lloyd-Williams | 549 | 25.1 | ||
| Conservative | David Millican | 540 | 24.7 | ||
| Labour | Adam Fyfe | 325 | 14.9 | ||
| Majority | 1005 | 46.0 | |||
| Majority | 863 | 39.5 | |||
| Turnout | 42.3 | ||||
| Liberal Democrats hold | Swing | ||||
| Liberal Democrats hold | Swing | ||||
Easebourne
| Party | Candidate | Votes | % | ±% | |
|---|---|---|---|---|---|
| Conservative | Francis Hobbs | 534 | 58.2 | ||
| Liberal Democrats | Carl Keeling | 243 | 26.5 | ||
| Green | Leo Homewood | 76 | 8.3 | ||
| Labour | Gordon Churchill | 65 | 7.1 | ||
| Majority | 291 | 31.7 | |||
| Turnout | 38.0 | ||||
| Conservative hold | Swing | ||||
Fernhurst
| Party | Candidate | Votes | % | ±% | |
|---|---|---|---|---|---|
| Liberal Democrats | Eleanora Newbery | 892 | 69.4 | ||
| Conservative | Brett Burkhart | 853 | 66.4 | ||
| Conservative | Peter Wilding | 825 | 64.2 | ||
| Majority | 67 | 5.2 | N/A | ||
| Majority | N/A | N/A | N/A | ||
| Turnout | 33.8 | ||||
| Liberal Democrats gain from Conservative | Swing | ||||
| Conservative hold | Swing | N/A | |||
Fittleworth
| Party | Candidate | Votes | % | ±% | |
|---|---|---|---|---|---|
| Liberal Democrats | John Cross | 534 | 47.5 | ||
| Conservative | Alan Sutton | 506 | 45.0 | ||
| Green | David Ross | 84 | 7.5 | ||
| Majority | 28 | 2.5 | N/A | ||
| Turnout | 44.4 | ||||
| Liberal Democrats gain from Conservative | Swing | ||||
Goodwood
| Party | Candidate | Votes | % | ±% | |
|---|---|---|---|---|---|
| Conservative | Henry Potter | 450 | 47.1 | ||
| Liberal Democrats | Jack Lovejoy | 283 | 29.6 | ||
| Green | Philip Maber | 222 | 23.2 | ||
| Majority | 167 | 17.5 | |||
| Turnout | 33.6 | ||||
| Conservative hold | Swing | ||||
Harbour Villages
| Party | Candidate | Votes | % | ±% | |
|---|---|---|---|---|---|
| Liberal Democrats | Adrian Moss | 2,342 | 68.1 | ||
| Liberal Democrats | Richard Bates | 2,257 | 65.6 | ||
| Liberal Democrats | Stephen Johnson | 2,066 | 60.1 | ||
| Conservative | Penny Plant | 855 | 24.9 | ||
| Conservative | Sandra James | 755 | 21.9 | ||
| Green | Georgina Armour Glasius | 705 | 20.5 | ||
| Conservative | Jane Kilby | 690 | 20.1 | ||
| Independent | Kevin Mann | 341 | 9.9 | ||
| Labour | Susan Walsh | 309 | 9.0 | ||
| Majority | 1487 | 43.2 | |||
| Majority | 1502 | 43.7 | |||
| Majority | 1361 | 39.6 | N/A | ||
| Turnout | 45.2 | ||||
| Liberal Democrats hold | Swing | ||||
| Liberal Democrats hold | Swing | ||||
| Liberal Democrats gain from Conservative | Swing | ||||
Harting
| Party | Candidate | Votes | % | ±% | |
|---|---|---|---|---|---|
| Liberal Democrats | Tim O'Kelly | 942 | 76.5 | ||
| Conservative | Bob Hall | 289 | 23.5 | ||
| Majority | 653 | 53.0 | |||
| Turnout | 43.8 | ||||
| Liberal Democrats hold | Swing | ||||
Lavant
| Party | Candidate | Votes | % | ±% | |
|---|---|---|---|---|---|
| Liberal Democrats | Joseph Brookes-Harmer | 475 | 45.8 | ||
| Conservative | David Palmer | 457 | 44.1 | ||
| Labour | Rhiannon Brome Thompson | 105 | 10.1 | ||
| Majority | 18 | 1.7 | N/A | ||
| Turnout | 40.6 | ||||
| Liberal Democrats gain from Conservative | Swing | ||||
Loxwood
| Party | Candidate | Votes | % | ±% | |
|---|---|---|---|---|---|
| Liberal Democrats | Gareth Evans | 1,805 | 78.4 | ||
| Liberal Democrats | Charles Todhunter | 1,556 | 67.6 | ||
| Conservative | Paul North | 711 | 30.9 | ||
| Conservative | Steve Waight | 530 | 23.0 | ||
| Majority | 1094 | 47.5 | |||
| Majority | 1026 | 44.6 | |||
| Turnout | 42.8 | ||||
| Liberal Democrats hold | Swing | ||||
| Liberal Democrats gain from Conservative | Swing | ||||
Midhurst
| Party | Candidate | Votes | % | ±% | |
|---|---|---|---|---|---|
| Liberal Democrats | Jessica Brown-Fuller | 1,326 | 64.9 | ||
| Liberal Democrats | Hannah Burton | 1,112 | 54.4 | ||
| Conservative | Tom Richardson | 817 | 40.0 | ||
| Conservative | Nicola Holben | 694 | 34.0 | ||
| Labour | Don Fraser | 138 | 6.8 | ||
| Majority | 509 | 24.9 | N/A | ||
| Majority | 418 | 20.5 | |||
| Turnout | 39.0 | ||||
| Liberal Democrats gain from Independent | Swing | ||||
| Liberal Democrats hold | Swing | ||||
North Mundham and Tangmere
| Party | Candidate | Votes | % | ±% | |
|---|---|---|---|---|---|
| Liberal Democrats | David Betts | 1,123 | 66.6 | ||
| Liberal Democrats | Charlie Hastain | 880 | 52.2 | ||
| Conservative | Simon Oakley | 649 | 38.5 | ||
| Conservative | Terry O'Brien | 468 | 27.7 | ||
| Labour | Mark Todd | 253 | 15.0 | ||
| Majority | 474 | 28.1 | N/A | ||
| Majority | 412 | 24.4 | N/A | ||
| Turnout | 32.5 | ||||
| Liberal Democrats gain from Conservative | Swing | ||||
| Liberal Democrats gain from Conservative | Swing | ||||
Petworth
| Party | Candidate | Votes | % | ±% | |
|---|---|---|---|---|---|
| Liberal Democrats | Harsha Desai | 616 | 53.5 | ||
| Conservative | Janet Duncton | 450 | 39.1 | ||
| Labour | Jonathan Rodell | 56 | 4.9 | ||
| Green | Stephanie Carn | 30 | 2.6 | ||
| Majority | 166 | 14.4 | N/A | ||
| Turnout | 42.2 | ||||
| Liberal Democrats gain from Conservative | Swing | ||||
Selsey South
| Party | Candidate | Votes | % | ±% | |
|---|---|---|---|---|---|
| Local Alliance | Tim Johnson | 741 | 51.2 | ||
| Local Alliance | Steve Boulcott | 729 | 50.4 | ||
| Conservative | Roger Barrow | 479 | 33.1 | ||
| Conservative | Colin Rickman | 452 | 31.2 | ||
| Green | Jack Olley | 168 | 11.6 | ||
| Labour | Heather Smith | 153 | 10.6 | ||
| Liberal Democrats | Jill Hilliard | 119 | 8.2 | ||
| Reform UK | Simon Edginton | 54 | 3.7 | ||
| Majority | 262 | 18.1 | |||
| Majority | 277 | 19.1 | N/A | ||
| Turnout | 33.2 | ||||
| Local Alliance hold | Swing | ||||
| Local Alliance gain from Conservative | Swing | ||||
Sidlesham with Selsey North
| Party | Candidate | Votes | % | ±% | |
|---|---|---|---|---|---|
| Local Alliance | Donna Johnson | 631 | 47.9 | ||
| Local Alliance | Val Weller | 502 | 38.1 | ||
| Conservative | Tom Bromfield | 457 | 34.7 | ||
| Conservative | Nick Rose | 448 | 34.0 | ||
| Green | Andrew Swain | 308 | 23.4 | ||
| Liberal Democrats | Beth Meek | 152 | 11.5 | ||
| Labour | Phil White | 135 | 10.3 | ||
| Majority | 174 | 13.2 | |||
| Majority | 54 | 4.1 | N/A | ||
| Turnout | 30.1 | ||||
| Local Alliance hold | Swing | ||||
| Local Alliance gain from Conservative | Swing | ||||
Southbourne
| Party | Candidate | Votes | % | ±% | |
|---|---|---|---|---|---|
| Liberal Democrats | Tracie Bangert | 1,226 | 68.9 | ||
| Liberal Democrats | Oona Hickson | 1,034 | 58.1 | ||
| Conservative | Jake Sawkins | 463 | 26.0 | ||
| Conservative | Bob Gould | 409 | 23.0 | ||
| Green | Derrick Johnson | 303 | 17.0 | ||
| Labour | Sorcha Galvin | 125 | 7.0 | ||
| Majority | 763 | 42.9 | |||
| Majority | 625 | 35.1 | |||
| Turnout | 34.0 | ||||
| Liberal Democrats hold | Swing | ||||
| Liberal Democrats hold | Swing | ||||
The Witterings
| Party | Candidate | Votes | % | ±% | |
|---|---|---|---|---|---|
| Liberal Democrats | Mark Chilton | 1,302 | 48.8 | ||
| Liberal Democrats | Iain Ballantyne | 1,234 | 46.3 | ||
| Conservative | Elizabeth Hamilton | 1,118 | 41.9 | ||
| Liberal Democrats | David Thompson | 1,112 | 41.7 | ||
| Conservative | Susan Taylor | 1,099 | 41.2 | ||
| Conservative | Joanna El-Batal | 996 | 37.4 | ||
| No Description | Graeme Barrett | 591 | 22.2 | ||
| Labour | Joe O'Sullivan | 374 | 14.0 | ||
| Reform UK | Pat Hunt | 172 | 6.5 | ||
| Majority | 203 | 7.6 | N/A | ||
| Majority | 238 | 8.9 | N/A | ||
| Majority | 6 | 0.2 | |||
| Turnout | 37.0 | ||||
| Liberal Democrats gain from Conservative | Swing | ||||
| Liberal Democrats gain from Conservative | Swing | ||||
| Conservative hold | Swing | ||||
Westbourne
| Party | Candidate | Votes | % | ±% | |
|---|---|---|---|---|---|
| Conservative | Roy Briscoe | 563 | 45.3 | ||
| Liberal Democrats | Helen Penfold | 543 | 43.7 | ||
| Green | Ann Stewart | 100 | 8.0 | ||
| Labour | Luca Clark-Gutierrez | 37 | 3.0 | ||
| Majority | 20 | 1.6 | |||
| Turnout | 46.8 | ||||
| Conservative hold | Swing | ||||
References
- Karen Dunn (29 September 2020). "Two Chichester councillors quit Conservatives". Greatest Hits Radio (Sussex).
- "District and Parish Election Results 2023". Chichester District Council. 2023.
| West Sussex CC | |
|---|---|
| Adur | |
| Arun | |
| Chichester | |
| Crawley | |
| Horsham | |
| Mid Sussex | |
| Worthing | |
| |
This article is issued from Wikipedia. The text is licensed under Creative Commons - Attribution - Sharealike. Additional terms may apply for the media files.