2023 Stafford Borough Council election
The 2023 Stafford Borough Council election took place on 4 May 2023 to elect members of Stafford Borough Council in Staffordshire, England.[3] This was on the same day as other local elections across England.
| |||||||||||||||||||||||||||||||||||||||||||||||||||||||||||||||||
All 40 seats to Stafford Borough Council 21 seats needed for a majority | |||||||||||||||||||||||||||||||||||||||||||||||||||||||||||||||||
|---|---|---|---|---|---|---|---|---|---|---|---|---|---|---|---|---|---|---|---|---|---|---|---|---|---|---|---|---|---|---|---|---|---|---|---|---|---|---|---|---|---|---|---|---|---|---|---|---|---|---|---|---|---|---|---|---|---|---|---|---|---|---|---|---|---|
| |||||||||||||||||||||||||||||||||||||||||||||||||||||||||||||||||
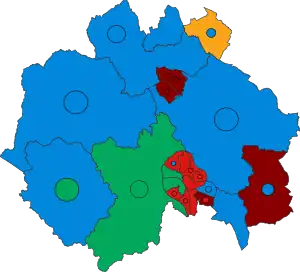 Winner of each seat at the 2023 Stafford Borough Council election | |||||||||||||||||||||||||||||||||||||||||||||||||||||||||||||||||
| |||||||||||||||||||||||||||||||||||||||||||||||||||||||||||||||||
Summary
Election Result
| 2023 Stafford Borough Council election | ||||||||||
|---|---|---|---|---|---|---|---|---|---|---|
| Party | Candidates | Seats | Gains | Losses | Net gain/loss | Seats % | Votes % | Votes | +/− | |
| Conservative | 39 | 14 | 0 | 8 | 35.0 | 36.1 | 20,843 | –12.4 | ||
| Labour | 32 | 13 | 3 | 0 | 32.5 | 29.1 | 16,764 | +1.9 | ||
| Stafford Ind. | 14 | 7 | 7 | 0 | 17.5 | 17.5 | 10,094 | N/A | ||
| Green | 24 | 5 | 4 | 0 | 12.5 | 13.4 | 7,704 | +10.4 | ||
| Liberal Democrats | 3 | 1 | 1 | 0 | 2.5 | 2.5 | 1,417 | +1.6 | ||
| Reform UK | 7 | 0 | 0 | 0 | 0.0 | 1.3 | 777 | N/A | ||
| Independent | 3 | 0 | 0 | 7 | 0.0 | 0.2 | 107 | –14.5 | ||
Results by Ward
The Statement of Persons Nominated, which details the candidates standing in each ward, was released by Stafford Borough Council following the close of nominations on 5 April 2023.[4]
Barlaston
| Party | Candidate | Votes | % | ±% | |
|---|---|---|---|---|---|
| Conservative | Evan Jones* | 368 | 54.0 | ||
| Labour | Richard Sidley | 209 | 30.7 | ||
| Green | Karen Davies | 104 | 15.3 | ||
| Majority | 159 | 23.3 | |||
| Turnout | 681 | 30.3 | |||
| Conservative hold | Swing | ||||
Baswich
| Party | Candidate | Votes | % | ±% | |
|---|---|---|---|---|---|
| Conservative | Ann Edgeller* | 915 | 49.9 | ||
| Conservative | Marnie Phillips* | 688 | 37.5 | ||
| Labour | Alison Carr | 633 | 34.5 | ||
| Labour | Kulwant Kang | 524 | 28.6 | ||
| Stafford Ind. | Maria Davies | 357 | 19.5 | ||
| Stafford Ind. | Paul Woodhead | 346 | 18.9 | ||
| Green | Timothy Boardman | 205 | 11.2 | ||
| Turnout | 39.6 | ||||
| Conservative hold | |||||
| Conservative hold | |||||
Common
| Party | Candidate | Votes | % | ±% | |
|---|---|---|---|---|---|
| Labour Co-op | Aidan Godfrey* | 439 | 63.0 | ||
| Conservative | Peter Martin | 178 | 25.5 | ||
| Green | Daniel Laidler | 80 | 11.5 | ||
| Majority | 261 | 37.5 | |||
| Turnout | 23.3 | ||||
| Labour Co-op hold | Swing | ||||
Coton
| Party | Candidate | Votes | % | ±% | |
|---|---|---|---|---|---|
| Labour Co-op | Louise Nixon* | 645 | 68.3 | ||
| Labour Co-op | Ant Reid | 564 | 59.7 | ||
| Conservative | Neil Glover | 214 | 22.7 | ||
| Conservative | Paul Startin | 160 | 16.9 | ||
| Green | Michael Spight | 131 | 13.9 | ||
| Reform UK | Michael Riley | 100 | 10.6 | ||
| Reform UK | Steven Spennewyn | 74 | 7.8 | ||
| Turnout | 19.7 | ||||
| Labour Co-op hold | |||||
| Labour Co-op hold | |||||
Doxey and Castletown
| Party | Candidate | Votes | % | ±% | |
|---|---|---|---|---|---|
| Green | Tony Pearce* | 447 | 56.1 | ||
| Labour | Richard Duffy | 146 | 18.3 | ||
| Conservative | James Brampton | 97 | 12.2 | ||
| Independent | Eleanor Tristram | 60 | 7.5 | ||
| Independent | Isabella Davies | 47 | 5.9 | ||
| Majority | 301 | 37.8 | |||
| Turnout | 28.8 | ||||
| Green hold | Swing | ||||
Eccleshall
| Party | Candidate | Votes | % | ±% | |
|---|---|---|---|---|---|
| Conservative | Jeremy Pert* | 1,028 | 61.4 | ||
| Conservative | Peter Jones* | 949 | 56.7 | ||
| Labour | Kate Hanley | 591 | 35.3 | ||
| Labour | Sally Osborne-Town | 444 | 26.5 | ||
| Green | Gillian Douce | 338 | 20.2 | ||
| Turnout | 33.6 | ||||
| Conservative hold | |||||
| Conservative hold | |||||
Forebridge
| Party | Candidate | Votes | % | ±% | |
|---|---|---|---|---|---|
| Labour Co-op | Julian Thorley | 418 | 56.1 | ||
| Conservative | James Cantrill | 188 | 25.2 | ||
| Green | Robert Norman | 139 | 18.7 | ||
| Majority | 230 | 30.9 | |||
| Turnout | 28.0 | ||||
| Labour Co-op gain from Independent | Swing | ||||
Fulford
| Party | Candidate | Votes | % | ±% | |
|---|---|---|---|---|---|
| Liberal Democrats | Alec Sandiford | 693 | 54.5 | ||
| Conservative | Michael Dodson* | 576 | 45.3 | ||
| Conservative | Lynne Bakker-Collier | 515 | 40.5 | ||
| Liberal Democrats | Maria Moore | 429 | 33.7 | ||
| Labour | Charlie Nutt | 331 | 26.0 | ||
| Turnout | 30.2 | ||||
| Liberal Democrats gain from Conservative | |||||
| Conservative hold | |||||
Gnosall and Woodseaves
| Party | Candidate | Votes | % | ±% | |
|---|---|---|---|---|---|
| Conservative | Mark Winnington* | 962 | 48.6 | ||
| Green | Scott Spencer | 926 | 46.8 | ||
| Conservative | Patrick Farrington* | 914 | 46.1 | ||
| Green | Dave Whittaker | 828 | 41.8 | ||
| Reform UK | Richard Harris | 171 | 8.6 | ||
| Reform UK | Susan Harris | 160 | 8.1 | ||
| Turnout | 38.0 | ||||
| Conservative hold | |||||
| Green gain from Conservative | |||||
Haywood and Hixon
| Party | Candidate | Votes | % | ±% | |
|---|---|---|---|---|---|
| Stafford Ind. | Brandan McKeown* | 1,088 | 72.4 | ||
| Conservative | Andy Cooper | 861 | 57.3 | ||
| Labour | Julian Porter | 684 | 45.5 | ||
| Green | Victoria Door | 373 | 24.8 | ||
| Turnout | 36.4 | ||||
| Stafford Ind. gain from Independent | |||||
| Conservative hold | |||||
Highfields and Western Downs
| Party | Candidate | Votes | % | ±% | |
|---|---|---|---|---|---|
| Labour Co-op | Andy McNaughton | 597 | 55.4 | ||
| Labour Co-op | Dee McNaughton* | 548 | 50.9 | ||
| Conservative | Roy Clarke | 358 | 33.2 | ||
| Conservative | Barbara Riddle | 334 | 31.0 | ||
| Green | Jake Mahal | 162 | 15.0 | ||
| Green | Rosemary Musson | 156 | 14.5 | ||
| Turnout | 23.3 | ||||
| Labour Co-op hold | |||||
| Labour Co-op hold | |||||
Holmcroft
| Party | Candidate | Votes | % | ±% | |
|---|---|---|---|---|---|
| Labour | Frank James | 797 | 49.9 | ||
| Conservative | Bryan Cross* | 790 | 49.5 | ||
| Conservative | Jonathan Price* | 783 | 49.0 | ||
| Labour | Mick Lupton | 583 | 36.5 | ||
| Green | Jonathan Moore | 242 | 15.1 | ||
| Turnout | 31.2 | ||||
| Labour gain from Conservative | |||||
| Conservative hold | |||||
Littleworth
| Party | Candidate | Votes | % | ±% | |
|---|---|---|---|---|---|
| Labour Co-op | Gillian Pardesi* | 775 | 58.6 | ||
| Labour Co-op | Tony Nixon* | 704 | 53.2 | ||
| Conservative | Maria Redfern | 370 | 28.0 | ||
| Conservative | William Taylor | 370 | 28.0 | ||
| Green | Andrew Murray | 202 | 15.3 | ||
| Reform UK | Michael Bailey | 120 | 9.1 | ||
| Reform UK | Martyn Garbett | 106 | 8.0 | ||
| Turnout | 32.0 | ||||
| Labour Co-op hold | |||||
| Labour Co-op hold | |||||
Manor
| Party | Candidate | Votes | % | ±% | |
|---|---|---|---|---|---|
| Labour | Angela Loughran* | 853 | 62.1 | ||
| Labour | Anne Hobbs* | 785 | 57.2 | ||
| Conservative | Alex Oldridge | 450 | 32.8 | ||
| Conservative | Robert Gwynn | 432 | 31.5 | ||
| Green | Hayley Percival | 227 | 16.5 | ||
| Turnout | 28.5 | ||||
| Labour hold | |||||
| Labour hold | |||||
Milford
| Party | Candidate | Votes | % | ±% | |
|---|---|---|---|---|---|
| Conservative | Peter Edgeller | 444 | 48.6 | ||
| Labour | Nicholas Shaw | 344 | 37.6 | ||
| Green | Katherine Dewey | 126 | 13.8 | ||
| Majority | 100 | 11.0 | |||
| Turnout | 38.2 | ||||
| Conservative hold | Swing | ||||
Milwich
| Party | Candidate | Votes | % | ±% | |
|---|---|---|---|---|---|
| Conservative | Frances Beatty* | 836 | 49.2 | ||
| Conservative | Karine Aspin | 752 | 44.2 | ||
| Stafford Ind. | Jim Davies | 424 | 24.9 | ||
| Labour | Kathryn Williams | 414 | 24.4 | ||
| Stafford Ind. | Susan McKeown | 403 | 23.7 | ||
| Labour | Paul McGee | 365 | 21.5 | ||
| Green | Tom Harris | 205 | 12.1 | ||
| Turnout | 34.5 | ||||
| Conservative hold | |||||
| Conservative hold | |||||
Penkside
| Party | Candidate | Votes | % | ±% | |
|---|---|---|---|---|---|
| Labour | Ralph Cooke* | 324 | 54.5 | ||
| Conservative | Anthony Boucker | 169 | 28.4 | ||
| Green | Roisin Chambers | 56 | 9.4 | ||
| Reform UK | Fran Clark | 46 | 7.7 | ||
| Majority | 155 | 26.1 | |||
| Turnout | 23.7 | ||||
| Labour hold | Swing | ||||
Rowley
| Party | Candidate | Votes | % | ±% | |
|---|---|---|---|---|---|
| Green | Doug Rouxel | 496 | 41.3 | ||
| Conservative | Carolyn Trowbridge* | 406 | 33.8 | ||
| Labour | Deborah Hawkes | 300 | 25.0 | ||
| Majority | 90 | 7.5 | |||
| Turnout | 1,202 | 40.1 | |||
| Green gain from Conservative | Swing | ||||
Seighford and Church Eaton
| Party | Candidate | Votes | % | ±% | |
|---|---|---|---|---|---|
| Green | Emma Carter | 974 | 55.8 | ||
| Green | Jack Rose | 777 | 44.5 | ||
| Conservative | Cathy Collier | 710 | 40.7 | ||
| Conservative | Geoff Collier | 681 | 39.0 | ||
| Labour | Joe McCormick | 349 | 20.0 | ||
| Turnout | 33.6 | ||||
| Green gain from Conservative | |||||
| Green gain from Conservative | |||||
St Michaels and Stonefield
| Party | Candidate | Votes | % | ±% | |
|---|---|---|---|---|---|
| Stafford Ind. | Rob Kenney* | 1,323 | 59.8 | ||
| Stafford Ind. | Philip Leason* | 1,306 | 59.0 | ||
| Stafford Ind. | Ian Fordham* | 1,219 | 55.1 | ||
| Labour | Mike Osborne-Town | 863 | 39.0 | ||
| Conservative | Simon Bell | 795 | 35.9 | ||
| Conservative | Adrian Harding | 679 | 30.7 | ||
| Conservative | Duncan Sandbrook | 454 | 20.5 | ||
| Turnout | 32.9 | ||||
| Stafford Ind. gain from Independent | |||||
| Stafford Ind. gain from Independent | |||||
| Stafford Ind. gain from Independent | |||||
Swynnerton and Oulton
| Party | Candidate | Votes | % | ±% | |
|---|---|---|---|---|---|
| Conservative | Roy James* | 676 | 43.8 | ||
| Conservative | James Nixon* | 546 | 35.4 | ||
| Labour | Adrian Holmes | 435 | 28.2 | ||
| Stafford Ind. | Kerry Dawson | 356 | 23.0 | ||
| Labour | Paul Warman | 347 | 22.5 | ||
| Liberal Democrats | Philip Jones | 295 | 19.1 | ||
| Stafford Ind. | Jason Metters | 239 | 15.5 | ||
| Green | Simon Capewell | 195 | 12.6 | ||
| Turnout | 32.2 | ||||
| Conservative hold | |||||
| Conservative hold | |||||
Walton
| Party | Candidate | Votes | % | ±% | |
|---|---|---|---|---|---|
| Stafford Ind. | Jill Hood* | 1,144 | 81.6 | ||
| Stafford Ind. | Jon Powell | 658 | 46.9 | ||
| Labour | Bill Lockwood | 536 | 38.2 | ||
| Conservative | Ivor Parry | 252 | 18.0 | ||
| Conservative | Stephen Walker | 213 | 15.2 | ||
| Turnout | 27.7 | ||||
| Stafford Ind. gain from Independent | |||||
| Stafford Ind. gain from Independent | |||||
Weeping Cross and Wildwood
| Party | Candidate | Votes | % | ±% | |
|---|---|---|---|---|---|
| Stafford Ind. | Jenny Barron* | 639 | 36.6 | ||
| Labour | Julie Read | 630 | 36.1 | ||
| Stafford Ind. | Ray Barron* | 592 | 33.9 | ||
| Labour | James Withington | 587 | 33.6 | ||
| Conservative | Steph Travis | 372 | 21.3 | ||
| Conservative | Lianne al-Khaldi | 358 | 20.4 | ||
| Green | Sarah Matthews | 189 | 10.8 | ||
| Green | Martin Sandbrook | 126 | 7.2 | ||
| Turnout | 38.0 | ||||
| Stafford Ind. gain from Conservative | |||||
| Labour gain from Conservative | |||||
References
- "Councillor Patrick M M Farrington". Stafford Borough Council. Retrieved 2 May 2023.
- "Councillor Aidan T A Godfrey". Stafford Borough Council. Retrieved 2 May 2023.
- "Notice of Election" (PDF). Stafford Borough Council. 27 March 2023. Retrieved 25 April 2023.
- "Statement of Persons Nominated" (PDF). Stafford Borough Council. 5 April 2023. Retrieved 25 April 2023.
This article is issued from Wikipedia. The text is licensed under Creative Commons - Attribution - Sharealike. Additional terms may apply for the media files.