2023 Mid Sussex District Council election
The 2023 Mid Sussex District Council election took place on 4 May 2023 to elect members of Mid Sussex District Council in West Sussex, England.[2] This would be on the same day as other local elections in England.
| ||||||||||||||||||||||||||||||||||||||||||||||||||||||||||||||||||||
All 48 seats to Mid Sussex District Council 25 seats needed for a majority | ||||||||||||||||||||||||||||||||||||||||||||||||||||||||||||||||||||
|---|---|---|---|---|---|---|---|---|---|---|---|---|---|---|---|---|---|---|---|---|---|---|---|---|---|---|---|---|---|---|---|---|---|---|---|---|---|---|---|---|---|---|---|---|---|---|---|---|---|---|---|---|---|---|---|---|---|---|---|---|---|---|---|---|---|---|---|---|
| ||||||||||||||||||||||||||||||||||||||||||||||||||||||||||||||||||||
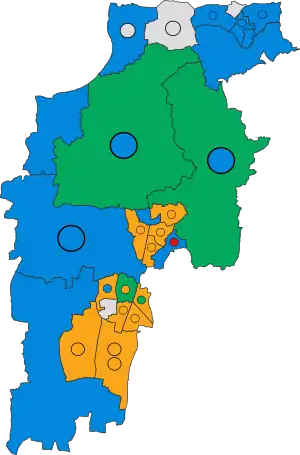 Winner of each seat at the 2023 Mid Sussex District Council election | ||||||||||||||||||||||||||||||||||||||||||||||||||||||||||||||||||||
| ||||||||||||||||||||||||||||||||||||||||||||||||||||||||||||||||||||
New ward boundaries were drawn up for this election, with the number of seats on the council reducing from 54 to 48.[3]
Summary
Election result
| 2023 Mid Sussex District Council election | ||||||||||
|---|---|---|---|---|---|---|---|---|---|---|
| Party | Candidates | Seats | Gains | Losses | Net gain/loss | Seats % | Votes % | Votes | +/− | |
| Liberal Democrats | 39 | 20 | 8 | 0 | 41.7 | 37.0 | 28,248 | +6.8 | ||
| Conservative | 48 | 18 | 0 | 11 | 37.5 | 32.9 | 25,147 | –7.1 | ||
| Independent | 20 | 5 | 1 | 0 | 10.4 | 10.3 | 7,858 | +2.1 | ||
| Green | 25 | 4 | 1 | 0 | 8.3 | 12.0 | 9,172 | +0.6 | ||
| Labour | 19 | 1 | 1 | 0 | 2.1 | 7.7 | 5,870 | –1.5 | ||
| Monster Raving Loony | 1 | 0 | 0 | 0 | 0.0 | 0.2 | 150 | N/A | ||
Ward results
The Statement of Persons Nominated, which details the candidates standing in each ward, was released by Mid Sussex District Council following the close of nominations on 4 April 2023.[4]
Ardingly, Balcombe & Turners Hill
| Party | Candidate | Votes | % | ±% | |
|---|---|---|---|---|---|
| Green | Jenny Edwards* | 709 | 40.4 | ||
| Conservative | Gary Marsh* | 567 | 32.3 | ||
| Green | Matt Brewin | 565 | 32.2 | ||
| Conservative | Bruce Forbes | 511 | 29.2 | ||
| Independent | Julian Smith | 393 | 22.4 | ||
| Liberal Democrats | Ben Jerrit | 358 | 20.4 | ||
| Independent | Barry Theobald | 243 | 13.9 | ||
| Turnout | 1,753 | 37.8 | |||
| Registered electors | 4,650 | ||||
| Green win (new seat) | |||||
| Conservative win (new seat) | |||||
Ashurst Wood & East Grinstead South
| Party | Candidate | Votes | % | ±% | |
|---|---|---|---|---|---|
| Conservative | John Belsey* | 535 | 64.0 | ||
| Green | Pete Wells | 168 | 20.1 | ||
| Liberal Democrats | Graham Knight | 133 | 15.9 | ||
| Majority | 367 | 43.9 | |||
| Turnout | 836 | 41.1 | |||
| Registered electors | 2,053 | ||||
| Conservative win (new seat) | |||||
Burgess Hill Dunstall
| Party | Candidate | Votes | % | ±% | |
|---|---|---|---|---|---|
| Liberal Democrats | Mike Kennedy | 648 | 41.6 | ||
| Conservative | Mustak Miah | 622 | 40.0 | ||
| Liberal Democrats | Giles Parsons | 553 | 35.5 | ||
| Conservative | Chris Mucklestone | 526 | 33.8 | ||
| Independent | Yann Davies | 249 | 16.0 | ||
| Labour | Pam Haigh | 174 | 11.2 | ||
| Turnout | 1,556 | 38.0 | |||
| Registered electors | 4,100 | ||||
| Liberal Democrats gain from Conservative | |||||
| Conservative hold | |||||
Burgess Hill Franklands
| Party | Candidate | Votes | % | ±% | |
|---|---|---|---|---|---|
| Liberal Democrats | Janice Henwood* | 1,130 | 63.0 | ||
| Liberal Democrats | David Eggleton | 1,107 | 61.7 | ||
| Conservative | Claire Fussell | 404 | 22.5 | ||
| Conservative | Tobias Parker | 393 | 21.9 | ||
| Independent | Andy Stowe | 328 | 18.3 | ||
| Turnout | 1,793 | 43.0 | |||
| Registered electors | 4,213 | ||||
| Liberal Democrats hold | |||||
| Liberal Democrats hold | |||||
Burgess Hill Leylands
| Party | Candidate | Votes | % | ±% | |
|---|---|---|---|---|---|
| Green | Anne Eves* | 848 | 61.5 | ||
| Liberal Democrats | Simon Hicks* | 813 | 59.0 | ||
| Conservative | Colin Holden | 383 | 27.8 | ||
| Conservative | Adam White | 331 | 24.0 | ||
| Turnout | 1,379 | 37.7 | |||
| Registered electors | 3,702 | ||||
| Green hold | |||||
| Liberal Democrats hold | |||||
Burgess Hill Meeds & Hammonds
| Party | Candidate | Votes | % | ±% | |
|---|---|---|---|---|---|
| Liberal Democrats | Robert Eggleston* | 1,208 | 67.0 | ||
| Liberal Democrats | Tofojjul Hussain* | 1,046 | 58.0 | ||
| Independent | Sean Kelly | 402 | 22.3 | ||
| Conservative | Cherry Catharine | 334 | 18.5 | ||
| Conservative | Elizabeth White | 287 | 15.9 | ||
| Turnout | 1,803 | 38.1 | |||
| Registered electors | 4,770 | ||||
| Liberal Democrats win (new seat) | |||||
| Liberal Democrats win (new seat) | |||||
Burgess Hill St Andrews
| Party | Candidate | Votes | % | ±% | |
|---|---|---|---|---|---|
| Liberal Democrats | Christine Cherry | 800 | 45.5 | ||
| Green | Matthew Cornish* | 665 | 37.8 | ||
| Independent | Ray Woods | 442 | 25.1 | ||
| Conservative | Jeremy Catharine | 368 | 20.9 | ||
| Labour | Joanne Rodway | 319 | 18.1 | ||
| Conservative | Toby Dawson | 317 | 18.0 | ||
| Labour | Rebecca Sinnatt | 212 | 12.1 | ||
| Turnout | 1,758 | 35.0 | |||
| Registered electors | 5,057 | ||||
| Liberal Democrats hold | |||||
| Green hold | |||||
Burgess Hill Victoria
| Party | Candidate | Votes | % | ±% | |
|---|---|---|---|---|---|
| Independent | Peter Chapman* | 666 | 66.7 | ||
| Labour | Linda Gregory | 201 | 20.1 | ||
| Conservative | Martin Willcock | 132 | 13.2 | ||
| Majority | 465 | 46.6 | |||
| Turnout | 999 | 32.4 | |||
| Registered electors | 3,124 | ||||
| Independent hold | |||||
Copthorne and Worth
| Party | Candidate | Votes | % | ±% | |
|---|---|---|---|---|---|
| Conservative | Graham Casella | 612 | 50.9 | ||
| Independent | Christopher Phillips* | 505 | 42.0 | ||
| Conservative | Tony Dorey | 481 | 40.0 | ||
| Liberal Democrats | Maggie Aston | 323 | 26.9 | ||
| Green | Lorcan Smith | 219 | 18.2 | ||
| Turnout | 1,202 | 28.2 | |||
| Registered electors | 4,276 | ||||
| Conservative gain from Independent | |||||
| Independent hold | |||||
Crawley Down
| Party | Candidate | Votes | % | ±% | |
|---|---|---|---|---|---|
| Independent | Ian Gibson* | 1,080 | 62.6 | ||
| Independent | John Hitchcock | 980 | 56.8 | ||
| Conservative | Liz Williams | 439 | 25.5 | ||
| Conservative | Philip Coote* | 403 | 23.4 | ||
| Green | Gordon Westcott | 188 | 10.9 | ||
| Liberal Democrats | Matthew Goldsmith | 159 | 9.2 | ||
| Turnout | 1,724 | 37.2 | |||
| Registered electors | 4,653 | ||||
| Independent win (new seat) | |||||
| Independent win (new seat) | |||||
Cuckfield, Bolney & Ansty
| Party | Candidate | Votes | % | ±% | |
|---|---|---|---|---|---|
| Conservative | Malcolm Avery | 894 | 45.3 | ||
| Conservative | Jim Knight* | 706 | 35.8 | ||
| Liberal Democrats | Barbara King | 540 | 27.4 | ||
| Independent | Sacha Dykes | 419 | 21.2 | ||
| Liberal Democrats | James Holloway | 367 | 18.6 | ||
| Green | Rachel McNamara | 360 | 18.3 | ||
| Labour | Andrew Foster | 292 | 14.8 | ||
| Monster Raving Loony | Baron Von Thunderclap | 150 | 7.6 | ||
| Turnout | 1,972 | 39.4 | |||
| Registered electors | 5,007 | ||||
| Conservative win (new seat) | |||||
| Conservative win (new seat) | |||||
Downland Villages
| Party | Candidate | Votes | % | ±% | |
|---|---|---|---|---|---|
| Conservative | Geoff Zeidler | 511 | 55.5 | ||
| Liberal Democrats | Neville Searle | 185 | 20.1 | ||
| Labour | Norina O'Hare | 116 | 12.6 | ||
| Green | Clare Rogers | 109 | 11.8 | ||
| Majority | 326 | 35.4 | |||
| Turnout | 921 | 36.8 | |||
| Registered electors | 2,525 | ||||
| Conservative win (new seat) | |||||
East Grinstead Ashplats
| Party | Candidate | Votes | % | ±% | |
|---|---|---|---|---|---|
| Conservative | Margaret Belsey* | 696 | 48.6 | ||
| Conservative | Adam Peacock* | 561 | 39.2 | ||
| Liberal Democrats | Andrew Lane | 310 | 21.6 | ||
| Independent | Carly Godfrey | 272 | 19.0 | ||
| Green | Alex Langridge | 272 | 19.0 | ||
| Labour | Thomas Britton | 266 | 18.6 | ||
| Independent | Stef Hillwood | 254 | 17.7 | ||
| Turnout | 1,432 | 27.2 | |||
| Registered electors | 5,298 | ||||
| Conservative hold | |||||
| Conservative hold | |||||
East Grinstead Baldwins
| Party | Candidate | Votes | % | ±% | |
|---|---|---|---|---|---|
| Independent | Julie Mockford* | 340 | 38.5 | ||
| Conservative | Christopher Evans | 292 | 33.1 | ||
| Liberal Democrats | Fathi Tarada | 250 | 28.3 | ||
| Majority | 48 | 5.4 | |||
| Turnout | 882 | 33.1 | |||
| Registered electors | 2,687 | ||||
| Independent gain from Conservative | |||||
East Grinstead Herontye
| Party | Candidate | Votes | % | ±% | |
|---|---|---|---|---|---|
| Conservative | Dick Sweatman* | 429 | 45.6 | ||
| Liberal Democrats | Steve Hall | 272 | 28.9 | ||
| Independent | Nick Gibson | 126 | 13.4 | ||
| Green | Sharon Martin | 113 | 12.0 | ||
| Majority | 157 | 16.7 | |||
| Turnout | 940 | 35.0 | |||
| Registered electors | 2,706 | ||||
| Conservative hold | |||||
East Grinstead Imberhorne
| Party | Candidate | Votes | % | ±% | |
|---|---|---|---|---|---|
| Conservative | Rex Whittaker* | 666 | 43.2 | ||
| Conservative | Lee Farren | 530 | 34.4 | ||
| Independent | Heidi Brunsdon* | 517 | 33.5 | ||
| Liberal Democrats | Peter Williams | 412 | 26.7 | ||
| Green | Chrissie Masters | 342 | 22.2 | ||
| Independent | Christopher Lomas | 333 | 21.6 | ||
| Turnout | 1,542 | 31.4 | |||
| Registered electors | 4,989 | ||||
| Conservative hold | |||||
| Conservative hold | |||||
East Grinstead Town
| Party | Candidate | Votes | % | ±% | |
|---|---|---|---|---|---|
| Conservative | Jacquie Russell | 539 | 40.0 | ||
| Conservative | John Dabell* | 504 | 37.4 | ||
| Liberal Democrats | Steve Barnett | 498 | 36.9 | ||
| Liberal Democrats | Lee Gibbs | 378 | 28.0 | ||
| Green | Laura Buonocore | 203 | 15.0 | ||
| Independent | Norman Mockford | 199 | 14.8 | ||
| Labour | David Wilbraham | 183 | 13.6 | ||
| Turnout | 1,349 | 27.6 | |||
| Registered electors | 4,905 | ||||
| Conservative hold | |||||
| Conservative hold | |||||
Handcross & Pease Pottage
| Party | Candidate | Votes | % | ±% | |
|---|---|---|---|---|---|
| Conservative | Eric Prescott | 270 | 44.0 | ||
| Liberal Democrats | Peter Cox | 199 | 32.4 | ||
| Independent | Carole Steggles | 145 | 23.6 | ||
| Majority | 71 | 11.6 | |||
| Turnout | 621 | 23.4 | |||
| Registered electors | 2,655 | ||||
| Conservative win (new seat) | |||||
Hassocks
| Party | Candidate | Votes | % | ±% | |
|---|---|---|---|---|---|
| Liberal Democrats | Sue Hatton* | 2,314 | 75.2 | ||
| Liberal Democrats | Kristian Berggreen | 2,084 | 67.7 | ||
| Liberal Democrats | Christopher Hobbs | 1,699 | 55.2 | ||
| Conservative | Alex Simmons | 587 | 19.1 | ||
| Labour | Alison Whelan | 564 | 18.3 | ||
| Green | Marie Holmstrom | 541 | 17.6 | ||
| Conservative | Philip Beck | 474 | 15.4 | ||
| Conservative | Stephen Horsfield | 423 | 13.7 | ||
| Turnout | 3,077 | 46.0 | |||
| Registered electors | 6,727 | ||||
| Liberal Democrats hold | |||||
| Liberal Democrats hold | |||||
| Liberal Democrats hold | |||||
Haywards Heath Ashenground
| Party | Candidate | Votes | % | ±% | |
|---|---|---|---|---|---|
| Liberal Democrats | Richard Bates* | 873 | 48.5 | ||
| Liberal Democrats | Duncan Pascoe | 708 | 39.4 | ||
| Conservative | Sujan Wickremaratchi | 532 | 29.6 | ||
| Conservative | Justin Cromie | 467 | 26.0 | ||
| Labour | Murray Crump | 370 | 20.6 | ||
| Green | Richard Kail | 328 | 18.2 | ||
| Turnout | 1,799 | 33.2 | |||
| Registered electors | 5,424 | ||||
| Liberal Democrats hold | |||||
| Liberal Democrats gain from Conservative | |||||
Haywards Heath Bentswood & Heath
| Party | Candidate | Votes | % | ±% | |
|---|---|---|---|---|---|
| Liberal Democrats | Alison Rees | 751 | 45.5 | ||
| Liberal Democrats | Anthony Platts | 700 | 42.4 | ||
| Conservative | Rachel Cromie* | 560 | 33.9 | ||
| Conservative | Stephen Hillier* | 552 | 33.4 | ||
| Labour | Jack Taplin | 369 | 22.4 | ||
| Green | Deanna Nicholson | 311 | 18.8 | ||
| Labour | Benjamin Webb | 251 | 15.2 | ||
| Turnout | 1,651 | 29.6 | |||
| Registered electors | 5,644 | ||||
| Liberal Democrats win (new seat) | |||||
| Liberal Democrats win (new seat) | |||||
Haywards Heath Franklands
| Party | Candidate | Votes | % | ±% | |
|---|---|---|---|---|---|
| Conservative | Rod Clarke* | 620 | 36.8 | ||
| Labour | Paul Kenny | 594 | 35.3 | ||
| Labour | Tim Weekes | 562 | 33.4 | ||
| Conservative | Mike Pulfer* | 536 | 31.8 | ||
| Liberal Democrats | Anne-Marie Lucraft | 359 | 21.3 | ||
| Liberal Democrats | Susan Knight | 293 | 17.4 | ||
| Green | Caroline Mendes | 192 | 11.4 | ||
| Turnout | 1,685 | 36.8 | |||
| Registered electors | 4,608 | ||||
| Conservative hold | |||||
| Labour gain from Conservative | |||||
Haywards Heath Lucastes & Bolnore
| Party | Candidate | Votes | % | ±% | |
|---|---|---|---|---|---|
| Liberal Democrats | Paul Lucraft | 715 | 39.1 | ||
| Liberal Democrats | Abdul Bashar | 710 | 38.8 | ||
| Conservative | Ruth De Mierre* | 704 | 38.5 | ||
| Conservative | Alastair McPherson | 697 | 38.1 | ||
| Green | Allan Murray | 375 | 20.5 | ||
| Labour | Nick Lashmar | 372 | 20.4 | ||
| Turnout | 1,828 | 35.4 | |||
| Registered electors | 5,241 | ||||
| Liberal Democrats win (new seat) | |||||
| Liberal Democrats win (new seat) | |||||
Haywards Heath North
| Party | Candidate | Votes | % | ±% | |
|---|---|---|---|---|---|
| Conservative | Sandy Ellis* | 400 | 35.7 | ||
| Liberal Democrats | Emiliano Mancino | 339 | 30.2 | ||
| Green | Richard Nicholson | 168 | 15.0 | ||
| Labour | David Morley | 167 | 14.9 | ||
| Independent | Christian Pitt | 47 | 4.2 | ||
| Majority | 61 | 5.5 | |||
| Turnout | 1,121 | 40.6 | |||
| Registered electors | 2,791 | ||||
| Conservative win (new seat) | |||||
Hurstpierpoint
| Party | Candidate | Votes | % | ±% | |
|---|---|---|---|---|---|
| Liberal Democrats | Alison Bennett* | 1,236 | 62.2 | ||
| Liberal Democrats | Rodney Jackson* | 1,050 | 52.8 | ||
| Conservative | Mark Scholfield | 471 | 23.7 | ||
| Conservative | Billy Lee | 444 | 22.3 | ||
| Labour | Graciano Soares | 328 | 16.5 | ||
| Green | Sue Kelly | 315 | 15.8 | ||
| Turnout | 1,988 | 41.1 | |||
| Registered electors | 4,869 | ||||
| Liberal Democrats win (new seat) | |||||
| Liberal Democrats win (new seat) | |||||
Lindfield
| Party | Candidate | Votes | % | ±% | |
|---|---|---|---|---|---|
| Liberal Democrats | Anne-Marie Cooke | 1,141 | 44.5 | ||
| Liberal Democrats | Cavan Wood | 1,020 | 39.8 | ||
| Conservative | Jonathan Ash-Edwards* | 906 | 35.3 | ||
| Conservative | Anthea Lea* | 855 | 33.3 | ||
| Green | David Woolley | 450 | 17.5 | ||
| Green | Stu Nisbett | 360 | 14.0 | ||
| Labour | Iain Maclean | 225 | 8.8 | ||
| Turnout | 2,565 | 48.5 | |||
| Registered electors | 5,329 | ||||
| Liberal Democrats gain from Conservative | |||||
| Liberal Democrats gain from Conservative | |||||
Lindfield Rural & High Weald
| Party | Candidate | Votes | % | ±% | |
|---|---|---|---|---|---|
| Green | Paul Brown* | 852 | 40.1 | ||
| Conservative | Lorraine Carvalho | 851 | 40.1 | ||
| Conservative | Sarah Webster | 821 | 38.7 | ||
| Liberal Democrats | Emily Lomax | 567 | 26.7 | ||
| Green | Nigel Cross | 519 | 24.4 | ||
| Labour | Mandy Claiden | 305 | 14.4 | ||
| Turnout | 2,124 | 39.8 | |||
| Registered electors | 5,363 | ||||
| Green win (new seat) | |||||
| Conservative win (new seat) | |||||
References
- "Local Political Parties". Mid Sussex District Council. Retrieved 1 May 2023.
- "Notice of Election" (PDF). Mid Sussex District Council. 20 March 2023. Retrieved 15 April 2023.
- "The Mid Sussex (Electoral Changes) Order 2022", legislation.gov.uk, The National Archives, SI 2022/812, retrieved 1 May 2023
- "Statement of Persons Nominated and Notice of Poll" (PDF). Mid Sussex District Council. 4 April 2023. Retrieved 15 April 2023.
| West Sussex CC | |
|---|---|
| Adur | |
| Arun | |
| Chichester | |
| Crawley | |
| Horsham | |
| Mid Sussex | |
| Worthing | |
| |
This article is issued from Wikipedia. The text is licensed under Creative Commons - Attribution - Sharealike. Additional terms may apply for the media files.