2023 Spelthorne Borough Council election
The 2023 Spelthorne Borough Council election took place on 4 May 2023 to elect members of Spelthorne Borough Council in Surrey, England.[2] This was on the same day as other local elections across England.
| ||||||||||||||||||||||||||||||||||||||||||||||||||||||||||||||||||||||||||||||||||
All 39 seats to Spelthorne Borough Council 20 seats needed for a majority | ||||||||||||||||||||||||||||||||||||||||||||||||||||||||||||||||||||||||||||||||||
|---|---|---|---|---|---|---|---|---|---|---|---|---|---|---|---|---|---|---|---|---|---|---|---|---|---|---|---|---|---|---|---|---|---|---|---|---|---|---|---|---|---|---|---|---|---|---|---|---|---|---|---|---|---|---|---|---|---|---|---|---|---|---|---|---|---|---|---|---|---|---|---|---|---|---|---|---|---|---|---|---|---|---|
| Registered | 77,255 | |||||||||||||||||||||||||||||||||||||||||||||||||||||||||||||||||||||||||||||||||
| Turnout | 24,293 (31.4%) | |||||||||||||||||||||||||||||||||||||||||||||||||||||||||||||||||||||||||||||||||
| ||||||||||||||||||||||||||||||||||||||||||||||||||||||||||||||||||||||||||||||||||
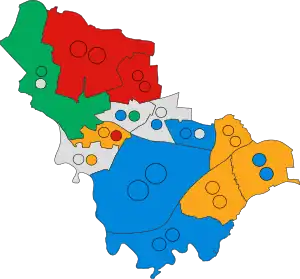 Winner of each seat at the 2023 Spelthorne Borough Council election | ||||||||||||||||||||||||||||||||||||||||||||||||||||||||||||||||||||||||||||||||||
| ||||||||||||||||||||||||||||||||||||||||||||||||||||||||||||||||||||||||||||||||||
Summary
Election result
| 2023 Spelthorne Borough Council election | ||||||||||
|---|---|---|---|---|---|---|---|---|---|---|
| Party | Candidates | Seats | Gains | Losses | Net gain/loss | Seats % | Votes % | Votes | +/− | |
| Conservative | 39 | 12 | 0 | 12 | 30.7 | 38.6 | 24,720 | –7.7 | ||
| Liberal Democrats | 14 | 10 | 2 | 0 | 25.6 | 18.6 | 11,893 | +1.1 | ||
| Independent | 18 | 7 | 5 | 0 | 17.9 | 17.7 | 11,363 | +13.6 | ||
| Labour | 14 | 7 | 6 | 1 | 17.9 | 13.6 | 8,696 | –2.3 | ||
| Green | 10 | 3 | 4 | 0 | 7.7 | 10.8 | 6,927 | +2.0 | ||
| TUSC | 3 | 0 | 0 | 0 | 0.0 | 0.1 | 37 | N/A | ||
| Reform UK | 2 | 0 | 0 | 0 | 0.0 | 0.5 | 350 | N/A | ||
Ward results
The results were declared on the 5 May 2023.[3]
Ashford Common
| Party | Candidate | Votes | % | ±% | |
|---|---|---|---|---|---|
| Conservative | Simon Bhadye | 783 | 40.7 | -10.9 | |
| Conservative | Naz Islam | 781 | 40.6 | -6.0 | |
| Independent | Katherine Rutherford | 773 | 40.2 | N/A | |
| Conservative | Jugjit Matharu | 709 | 36.9 | -4.7 | |
| Independent | David Alexander | 706 | 36.7 | N/A | |
| Labour | Andrew Lamb | 491 | 25.5 | +5.2 | |
| Liberal Democrats | Alan Mockford | 490 | 25.5 | +4.4 | |
| Rejected ballots | 6 | ||||
| Turnout | 1,929 | 29.8 | +2.7 | ||
| Conservative hold | |||||
| Conservative hold | |||||
| Independent gain from Conservative | |||||
Ashford East
| Party | Candidate | Votes | % | ±% | |
|---|---|---|---|---|---|
| Independent | Joanne Sexton** | 991 | 50.7 | N/A | |
| Independent | Elizabeth Baldock | 776 | 39.7 | N/A | |
| Conservative | Rose Chandler* | 714 | 36.5 | -8.3 | |
| Conservative | Keith Robinson | 615 | 31.5 | -15.4 | |
| Conservative | Vandana Tuteja | 544 | 27.8 | -14.7 | |
| Independent | John Enright | 467 | 23.9 | N/A | |
| Labour | Gerald Dare | 442 | 22.6 | +1.4 | |
| Green | Chris Hyde | 319 | 16.3 | -12.2 | |
| Independent | Gerald Gravett | 265 | 13.6 | N/A | |
| Green | Nigel Scott | 253 | 12.8 | N/A | |
| Rejected ballots | 3 | ||||
| Turnout | 1,958 | 33.3 | |||
| Independent gain from Conservative | |||||
| Independent gain from Conservative | |||||
| Conservative hold | |||||
Joanne Sexton was an incumbent in Ashford North and Stanwell South
Ashford North & Stanwell South
| Party | Candidate | Votes | % | ±% | |
|---|---|---|---|---|---|
| Labour | Sean Beatty | 728 | 43.3 | +7.9 | |
| Labour | Rebecca Geach | 695 | 41.3 | +6.0 | |
| Labour | Med Buck | 671 | 39.9 | +7.8 | |
| Conservative | Sonia Maya | 511 | 30.4 | -13.5 | |
| Conservative | Amar Brar* | 506 | 30.1 | -7.8 | |
| Conservative | Julie Fegredo | 497 | 29.5 | -10.4 | |
| Independent | Chris Davies | 421 | 25.0 | N/A | |
| Independent | Jason Lane | 395 | 23.5 | N/A | |
| Reform UK | Marian Rough | 178 | 10.6 | N/A | |
| Rejected ballots | 4 | ||||
| Turnout | 1,687 | 25.0 | +2.7 | ||
| Labour gain from Conservative | |||||
| Labour gain from Conservative | |||||
| Labour gain from Conservative | |||||
Ashford Town
| Party | Candidate | Votes | % | ±% | |
|---|---|---|---|---|---|
| Independent | Michelle Arnold | 801 | 39.2 | N/A | |
| Conservative | Olivia Rybinski* | 725 | 35.5 | -8.9 | |
| Green | Andrew McLuskey | 677 | 33.1 | -1.1 | |
| Conservative | Nick Gething* | 653 | 31.9 | -17.0 | |
| Conservative | Paul Woodward | 651 | 31.8 | -11.5 | |
| Labour | Mark Kluth | 571 | 27.9 | -3.8 | |
| Green | Dene Winch | 548 | 26.8 | +4.8 | |
| Independent | Robin Henfrey | 519 | 25.4 | N/A | |
| Independent | Quentin Edgington | 499 | 24.4 | N/A | |
| Rejected ballots | 1 | ||||
| Turnout | 2,046 | 34.4 | |||
| Independent gain from Conservative | |||||
| Conservative hold | |||||
| Green gain from Conservative | |||||
Halliford & Sunbury West
| Party | Candidate | Votes | % | ±% | |
|---|---|---|---|---|---|
| Liberal Democrats | Sandra Dunn* | 1,014 | 63.5 | +9.5 | |
| Liberal Democrats | Lawrence Nichols* | 921 | 57.6 | +14.4 | |
| Liberal Democrats | John Turner | 833 | 52.1 | +4.6 | |
| Conservative | Michael Brennan | 489 | 30.6 | -1.7 | |
| Conservative | Anna Nowicka | 489 | 30.6 | +2.1 | |
| Conservative | Paul Robigo | 477 | 29.8 | +0.8 | |
| Labour | Roger Bowen | 281 | 17.6 | +6.0 | |
| Rejected ballots | 12 | ||||
| Turnout | 1,610 | 32.7 | –3.7 | ||
| Liberal Democrats hold | |||||
| Liberal Democrats hold | |||||
| Liberal Democrats hold | |||||
Laleham & Shepperton Green
| Party | Candidate | Votes | % | ±% | |
|---|---|---|---|---|---|
| Conservative | Karen Howkins* | 945 | 50.2 | -1.4 | |
| Conservative | Darren Clarke | 878 | 46.6 | +3.3 | |
| Conservative | Anant Mathur | 710 | 37.7 | -3.7 | |
| Green | Stuart Whitmore* | 673 | 35.7 | +7.1 | |
| Green | Jill Beecher | 614 | 32.6 | N/A | |
| Liberal Democrats | John Thesiger | 470 | 25.0 | +1.4 | |
| Labour | Pierre Cooper | 378 | 20.1 | -0.3 | |
| Independent | John Johnston | 192 | 10.2 | N/A | |
| TUSC | Andy Pattinson | 65 | 3.5 | N/A | |
| TUSC | Helen Couchman | 55 | 2.9 | N/A | |
| TUSC | Paul Couchman | 37 | 2.0 | N/A | |
| Rejected ballots | 9 | ||||
| Turnout | 1,892 | 30.2 | +1.5 | ||
| Conservative hold | |||||
| Conservative hold | |||||
| Conservative hold | |||||
Riverside & Laleham
| Party | Candidate | Votes | % | ±% | |
|---|---|---|---|---|---|
| Independent | Denise Saliagopoulos* | 1,191 | 56.1 | +8.0 | |
| Independent | Daniel Geraci | 1,046 | 49.3 | N/A | |
| Liberal Democrats | Michele Gibson* | 1,022 | 48.1 | +9.6 | |
| Conservative | Sinead Mooney* | 754 | 35.5 | -3.0 | |
| Conservative | Keith Malcouronne | 661 | 31.1 | -3.3 | |
| Conservative | Michael Zenonos | 619 | 29.2 | +1.2 | |
| Rejected ballots | 5 | ||||
| Turnout | 2,128 | 39.6 | |||
| Independent hold | |||||
| Independent gain from Conservative | |||||
| Liberal Democrats gain from Conservative | |||||
Shepperton Town
| Party | Candidate | Votes | % | ±% | |
|---|---|---|---|---|---|
| Conservative | Maureen Attewell** | 1,194 | 57.6 | -1.9 | |
| Conservative | Lisa Brennan | 955 | 46.0 | -8.6 | |
| Conservative | John Boughtflower** | 920 | 44.4 | -8.6 | |
| Green | Peter Hughes | 694 | 33.5 | +6.6 | |
| Liberal Democrats | Martin Gammon | 672 | 32.4 | +12.0 | |
| Labour Co-op | Stephen Bentley | 555 | 26.8 | +14.4 | |
| Independent | Sue Bryer | 423 | 20.4 | N/A | |
| Rejected ballots | 8 | ||||
| Turnout | 2,082 | 36.9 | –2.8 | ||
| Conservative hold | |||||
| Conservative hold | |||||
| Conservative hold | |||||
Maureen Attewell was a sitting councillor for Laleham and Shepperton Green John Boughtflower was a sitting councillor for Ashford East
Staines
| Party | Candidate | Votes | % | ±% | |
|---|---|---|---|---|---|
| Green | Malcolm Beecher* | 1,222 | 57.4 | +5.1 | |
| Green | Adam Gale | 1,169 | 54.9 | +7.3 | |
| Independent | Howard Williams | 942 | 44.2 | N/A | |
| Labour | Khalid Mustafa | 740 | 34.7 | +0.9 | |
| Conservative | Mark Francis | 537 | 25.2 | -8.5 | |
| Conservative | Trudy Burgess | 474 | 22.3 | -11.0 | |
| Conservative | Adrian Ulisse | 343 | 16.1 | -16.3 | |
| Rejected ballots | 9 | ||||
| Turnout | 2,139 | 31.2 | +1.3 | ||
| Green hold | |||||
| Green hold | |||||
| Independent gain from Labour | |||||
Staines South
| Party | Candidate | Votes | % | ±% | |
|---|---|---|---|---|---|
| Liberal Democrats | Chris Bateson* | 1,171 | 71.3 | +21.5 | |
| Liberal Democrats | Jolyon Caplin | 1,064 | 64.8 | +16.5 | |
| Labour | Tony Burrell | 769 | 46.8 | +17.0 | |
| Conservative | Kathy Hurst | 437 | 26.6 | +1.0 | |
| Conservative | Maurice Watts | 383 | 23.3 | ±0.0 | |
| Conservative | Graeme Reid | 337 | 20.5 | -2.8 | |
| Rejected ballots | 7 | ||||
| Turnout | 1,649 | 30.9 | +0.5 | ||
| Liberal Democrats hold | |||||
| Liberal Democrats hold | |||||
| Labour hold | |||||
Stanwell North
| Party | Candidate | Votes | % | ±% | |
|---|---|---|---|---|---|
| Labour | Susan Doran* | 804 | 53.1 | +8.5 | |
| Labour | Jon Button* | 798 | 52.7 | +16.3 | |
| Labour | John Doran* | 773 | 51.0 | +8.8 | |
| Conservative | Anita McIlroy | 632 | 41.7 | +9.8 | |
| Conservative | Jim McIlroy | 621 | 41.0 | +1.3 | |
| Conservative | Rohan Vijjhalwar | 476 | 31.4 | +5.3 | |
| Rejected ballots | 13 | ||||
| Turnout | 1,528 | 25.8 | –1.6 | ||
| Labour hold | |||||
| Labour gain from Conservative | |||||
| Labour hold | |||||
Sunbury Common
| Party | Candidate | Votes | % | ±% | |
|---|---|---|---|---|---|
| Liberal Democrats | Harry Boparai | 828 | 53.0 | +17.5 | |
| Liberal Democrats | Mary Bing Dong | 740 | 47.4 | +15.9 | |
| Liberal Democrats | Suraj Gyawali | 648 | 41.5 | +19.8 | |
| Independent | Ian Beardsmore* | 608 | 38.9 | -7.9 | |
| Independent | Jacqueline Stanton | 348 | 22.3 | N/A | |
| Conservative | Simon Rollo | 347 | 22.2 | -7.3 | |
| Conservative | Jayson Bhadye | 283 | 18.1 | -1.1 | |
| Conservative | Alex Sapunovas | 227 | 14.5 | -3.6 | |
| Reform UK | Rory O'Brien | 172 | 11.0 | N/A | |
| Rejected ballots | 5 | ||||
| Turnout | 1,562 | 25.7 | –3.0 | ||
| Liberal Democrats gain from Independent | |||||
| Liberal Democrats hold | |||||
| Liberal Democrats hold | |||||
Sunbury East
| Party | Candidate | Votes | % | ±% | |
|---|---|---|---|---|---|
| Liberal Democrats | Kathy Grant* | 1,068 | 51.6 | +8.7 | |
| Conservative | Buddhi Weerasinghe | 967 | 46.7 | -1.5 | |
| Conservative | Matthew Lee | 960 | 46.4 | -0.9 | |
| Liberal Democrats | Michael Alexiou | 952 | 46.0 | +7.6 | |
| Conservative | Jay Patel | 852 | 41.1 | -1.2 | |
| Green | Daniel Dollin | 758 | 36.6 | N/A | |
| Rejected ballots | 12 | ||||
| Turnout | 2,083 | 35.6 | +3.0 | ||
| Liberal Democrats hold | |||||
| Conservative hold | |||||
| Conservative hold | |||||
References
- "Your councillors". Spelthorne Borough Council. Retrieved 2 May 2023.
- "Local Elections - 4 May 2023". Spelthorne Borough Council. Retrieved 22 April 2023.
- "Election results". Spelthorne Borough Council. 5 May 2023. Retrieved 7 May 2023.
This article is issued from Wikipedia. The text is licensed under Creative Commons - Attribution - Sharealike. Additional terms may apply for the media files.