2018 Bolton Metropolitan Borough Council election
The 2018 Bolton Metropolitan Borough Council election took place on 3 May 2018 to elect members of Bolton Council in Greater Manchester, England.[1] This was on the same day as other local elections. The Labour Party retained overall control of the Council with a majority of 1.
The Metropolitan Borough of Bolton shown within England.
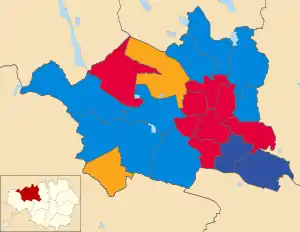
Map showing the results of the 2018 Bolton Metropolitan Borough Council election.
21 seats were contested and the Conservative Party won 9 seats, the Labour Party won 8 seats, the Liberal Democrats won 2 seats, and Farnworth and Kearsley First won 2 seats.[2]
After the election, the total composition of the council was as follows:
Election results
| Bolton Metropolitan Borough Council election results | |||||||||||||||
|---|---|---|---|---|---|---|---|---|---|---|---|---|---|---|---|
| Party | Candidates | Votes | |||||||||||||
| Stood | Elected | Gained | Unseated | Net | % of total | % | No. | Net % | |||||||
| Labour | 21 | 8 | 1 | 5 | 38.0 | 38.5 | 29,467 | ||||||||
| Conservative | 21 | 9 | 2 | 0 | 42.8 | 34.0 | 26,084 | ||||||||
| Liberal Democrats | 21 | 2 | 1 | 0 | 4.7 | 13.8 | 10,583 | ||||||||
| Farnworth and Kearsley First | 3 | 2 | 2 | 0 | 9.5 | 5.8 | 4,460 | N/A | |||||||
| UKIP | 7 | 0 | 0 | 1 | 0.0 | 2.9 | 2,263 | ||||||||
| Green | 13 | 0 | 0 | 0 | 0.0 | 2.7 | 2,072 | ||||||||
| Independent | 7 | 0 | 0 | 0 | 0.0 | 2.0 | 1,599 | ||||||||
| Totals | 93 | 21 | 100.0 | 100.0 | 76,528 | ||||||||||
Council Composition
Prior to the election the composition of the council was:
| 35 | 17 | 3 | 4 | 1 |
| Labour | Conservative | LD | U | FK |
After the election the composition of the council was:
| 31 | 19 | 4 | 3 | 3 |
| Labour | Conservative | LD | U | FK |
LD - Liberal Democrats
U - UKIP
FK - Farnworth and Kearsley First
Ward results
Astley Bridge ward
| Party | Candidate | Votes | % | ±% | |
|---|---|---|---|---|---|
| Conservative | John Walsh | 1,842 | 42.5 | +0.0 | |
| Liberal Democrats | Warren Fox | 1,564 | 36.1 | +15.6 | |
| Labour | Zulfi Jiva | 930 | 21.4 | -3.7 | |
| Majority | 278 | 6.4 | -11.1 | ||
| Turnout | 4,336 | 42.0 | -2.0 | ||
| Conservative hold | Swing | UKIP to Lib Dem 12.7 | |||
Bradshaw ward
| Party | Candidate | Votes | % | ±% | |
|---|---|---|---|---|---|
| Conservative | Mudasir Dean | 1,949 | 57.1 | +6.5 | |
| Labour | Tony Shepherd | 880 | 25.8 | +1.0 | |
| Independent | Eric Hyland | 278 | 8.1 | +2.7 | |
| Liberal Democrats | Stephen Howarth | 173 | 5.1 | +2.4 | |
| Green | Laura Diggle | 135 | 3.9 | +1.5 | |
| Majority | 1,069 | 31.3 | +5.5 | ||
| Turnout | 3,415 | 38.1 | -4.8 | ||
| Conservative hold | Swing | UKIP to Conservative 10.3 | |||
Breightmet ward
| Party | Candidate | Votes | % | ±% | |
|---|---|---|---|---|---|
| Conservative | Adele Warren | 1,549 | 47.4 | +21.5 | |
| Labour | Francesca Platt | 1,278 | 39.1 | +3.3 | |
| UKIP | Harry Lamb | 242 | 7.4 | -25.5 | |
| Green | Dan Bolton | 138 | 4.2 | +1.6 | |
| Liberal Democrats | Richard Bates | 61 | 1.9 | -0.8 | |
| Majority | 271 | 8.3 | |||
| Turnout | 3,268 | 34.4 | -2.6 | ||
| Conservative gain from Labour | Swing | UKIP to Conservative 23.5 | |||
Bromley Cross ward
| Party | Candidate | Votes | % | ±% | |
|---|---|---|---|---|---|
| Conservative | David Greenhalgh | 2,928 | 73.3 | ||
| Conservative | Nadim Muslim | 2,257 | 56.5 | ||
| Labour | Steve Sutton | 1,023 | 25.6 | ||
| Labour | Deb Whenlock | 910 | 22.8 | ||
| Green | Liz Spencer | 374 | 9.4 | ||
| Liberal Democrats | Elliott Bermudez-Galton | 303 | 7.6 | ||
| Liberal Democrats | David Walsh | 196 | 4.9 | ||
| Majority | (Greenhalgh) 1,905 | ||||
| Majority | (Muslim) 1,234 | ||||
| Turnout | 3,996 | 38.4 | |||
| Conservative hold | |||||
| Conservative hold | |||||
Crompton ward
| Party | Candidate | Votes | % | ±% | |
|---|---|---|---|---|---|
| Labour | Bilkis Ismail | 2,258 | 57.1 | -10.4 | |
| Conservative | Daniel Wheatley | 737 | 18.6 | +9.2 | |
| Independent | Siraj Patel | 706 | 17.8 | +17.8 | |
| Liberal Democrats | Michael Langdon | 252 | 6.4 | +2.7 | |
| Majority | 1,521 | 38.5 | -9.5 | ||
| Turnout | 3,953 | 36.8 | +0.9 | ||
| Labour hold | Swing | UKIP to Ind 18.6 | |||
Farnworth ward
| Party | Candidate | Votes | % | ±% | |
|---|---|---|---|---|---|
| Farnworth and Kearsley First | Maureen Flitcroft | 1,699 | 53.9 | +53.9 | |
| Labour | Martin McMulkin | 1,172 | 37.3 | -11.1 | |
| Conservative | Jennifer Kirk | 142 | 4.5 | -4.1 | |
| UKIP | Dave Harvey | 92 | 2.9 | -33.5 | |
| Liberal Democrats | David Cooper | 44 | 1.4 | -1.6 | |
| Majority | 522 | 16.5 | |||
| Turnout | 3,154 | 30.0 | |||
| Farnworth and Kearsley First gain from Labour | Swing | UKIP to FKF 43.7 | |||
Great Lever ward
| Party | Candidate | Votes | % | ±% | |
|---|---|---|---|---|---|
| Labour | Mohammed Ayub | 2,422 | 76.0 | +6.5 | |
| Conservative | Mohammed Waqas | 389 | 12.2 | +4.6 | |
| Green | David Figgins | 232 | 7.3 | +1.2 | |
| Liberal Democrats | Francine Godfrey | 143 | 4.5 | +0.6 | |
| Majority | 2,033 | 63.8 | +7.2 | ||
| Turnout | 3,186 | 32.9 | -1.4 | ||
| Labour hold | Swing | UKIP to Labour 9.7 | |||
Halliwell ward
| Party | Candidate | Votes | % | ±% | |
|---|---|---|---|---|---|
| Labour | Akhtar Zaman | 2,181 | 70.2 | +3.6 | |
| Conservative | Jolyon Coombs | 418 | 13.6 | +5.1 | |
| Liberal Democrats | John Falch | 120 | 3.8 | -0.2 | |
| Green | Ian McHugh | 118 | 3.8 | -0.7 | |
| Independent | Martin McLoughlin | 114 | 3.7 | +3.7 | |
| Independent | Sarfraz Nawaz | 83 | 2.7 | +2.7 | |
| Independent | Anthony Massey | 71 | 2.3 | +2.3 | |
| Majority | 1,767 | 56.8 | +6.6 | ||
| Turnout | 3,110 | 35.2 | -0.3 | ||
| Labour hold | Swing | UKIP to Conservative 10.7 | |||
Harper Green ward
| Party | Candidate | Votes | % | ±% | |
|---|---|---|---|---|---|
| Labour | Hamid Khurram | 1,910 | 53.3 | +3.8 | |
| Farnworth and Kearsley First | Lisa Weatherby | 897 | 25.1 | +25.1 | |
| Conservative | Robert Tyler | 477 | 13.4 | +1.7 | |
| UKIP | Amy Wunderley | 157 | 4.4 | -27.9 | |
| Green | Matthew Barnes | 63 | 1.8 | -1.7 | |
| Liberal Democrats | Kevin Walsh | 62 | 1.7 | -1.4 | |
| Majority | 1,013 | 28.4 | +11.2 | ||
| Turnout | 3,566 | 36.1 | +4.3 | ||
| Labour hold | Swing | UKIP to FKF 26.5 | |||
Heaton and Lostock ward
| Party | Candidate | Votes | % | ±% | |
|---|---|---|---|---|---|
| Conservative | Anne Galloway | 3,000 | 66.4 | +10.2 | |
| Labour | John Gillatt | 1,247 | 27.6 | +0.6 | |
| Liberal Democrats | Garry Veevers | 269 | 5.9 | +0.4 | |
| Majority | 1,753 | 38.8 | +9.5 | ||
| Turnout | 4,516 | 42.3 | -3.6 | ||
| Conservative hold | Swing | UKIP to Conservative 9.3 | |||
Horwich and Blackrod ward
| Party | Candidate | Votes | % | ±% | |
|---|---|---|---|---|---|
| Conservative | Susan Baines | 1,668 | 47.6 | +18.0 | |
| Labour | Michael Jarvis | 1,437 | 41.0 | -1.5 | |
| Liberal Democrats | Rebecca Forrest | 231 | 6.6 | +3.1 | |
| Green | Keith Cocker | 169 | 4.8 | -0.6 | |
| Majority | 231 | 6.6 | |||
| Turnout | 3,505 | 33.7 | -2.0 | ||
| Conservative gain from Labour | Swing | UKIP to Conservative 18.5 | |||
Horwich North East ward
| Party | Candidate | Votes | % | ±% | |
|---|---|---|---|---|---|
| Labour | Kevin McKeon | 1,345 | 36.0 | -4.9 | |
| Liberal Democrats | Stephen Rock | 1,288 | 34.5 | +14.3 | |
| Conservative | Joan Johnson | 887 | 23.8 | +3.5 | |
| Green | Rod Riesco | 213 | 5.7 | +0.8 | |
| Majority | 57 | 1.5 | -19.1 | ||
| Turnout | 3,733 | 38.0 | -2.7 | ||
| Labour hold | Swing | UKIP to Lib Dem 14.0 | |||
Hulton ward
| Party | Candidate | Votes | % | ±% | |
|---|---|---|---|---|---|
| Conservative | Diane Parkinson | 1,858 | 50.2 | +17.5 | |
| Labour | Rabiya Jiva | 1,451 | 39.2 | +2.2 | |
| UKIP | Beverley Fletcher | 215 | 5.8 | -18.7 | |
| Green | Chris Taylor | 107 | 2.9 | -0.4 | |
| Liberal Democrats | Kevin Mulligan | 68 | 1.8 | -0.7 | |
| Majority | 407 | 11.0 | |||
| Turnout | 3,699 | 37.0 | -1.4 | ||
| Conservative hold | Swing | UKIP to Conservative 18.1 | |||
Kearsley ward
| Party | Candidate | Votes | % | ±% | |
|---|---|---|---|---|---|
| Farnworth and Kearsley First | Julie Pattison | 1,864 | 52.3 | +52.3 | |
| Labour | Stephen Langley | 882 | 24.7 | -13.5 | |
| UKIP | Will Pilkington | 399 | 11.2 | -34.0 | |
| Conservative | Kamaran Fathulla | 290 | 8.1 | -1.1 | |
| Liberal Democrats | Connor Goodwin | 131 | 3.7 | -3.7 | |
| Majority | 982 | 27.5 | |||
| Turnout | 3,566 | 34.1 | +2.3 | ||
| Farnworth and Kearsley First gain from Labour | Swing | UKIP to FKF 43.1 | |||
Little Lever and Darcy Lever ward
| Party | Candidate | Votes | % | ±% | |
|---|---|---|---|---|---|
| Labour | David Evans | 1,249 | 37.5 | +10.1 | |
| Conservative | David Meehan | 1,000 | 30.0 | +19.3 | |
| UKIP | Paul Richardson | 926 | 27.8 | -11.5 | |
| Liberal Democrats | Christine MacPherson | 159 | 4.8 | -15.5 | |
| Majority | 249 | 7.5 | |||
| Turnout | 3,334 | 34.7 | -7.5 | ||
| Labour gain from UKIP | Swing | Lib Dem to Conservative 17.4 | |||
Rumworth ward
| Party | Candidate | Votes | % | ±% | |
|---|---|---|---|---|---|
| Labour | Ismail Ibrahim | 2,570 | 75.7 | +3.5 | |
| Conservative | Hafiz Butt | 379 | 11.2 | +0.7 | |
| Green | Alan Johnson | 251 | 7.4 | +2.4 | |
| Independent | Damien Walsh | 111 | 3.3 | +3.3 | |
| Liberal Democrats | Duncan MacPherson | 55 | 2.5 | +0.2 | |
| Majority | 2,191 | 64.5 | +2.8 | ||
| Turnout | 3,396 | 34.4 | -2.6 | ||
| Labour hold | Swing | UKIP to Labour 6.7 | |||
Smithills ward
| Party | Candidate | Votes | % | ±% | |
|---|---|---|---|---|---|
| Liberal Democrats | Doug Bagnall | 2,031 | 48.9 | -1.9 | |
| Labour | Ryan Quick | 1,260 | 30.3 | +4.7 | |
| Conservative | Sam Rimmer | 751 | 18.1 | +8.9 | |
| Green | Elizabeth McManus | 111 | 2.7 | +0.5 | |
| Majority | 771 | 18.6 | -6.6 | ||
| Turnout | 4,154 | 40.2 | -4.9 | ||
| Liberal Democrats hold | Swing | UKIP to Conservative 10.5 | |||
Tonge with The Haulgh ward
| Party | Candidate | Votes | % | ±% | |
|---|---|---|---|---|---|
| Labour | Nick Peel | 1,379 | 50.4 | +4.5 | |
| Conservative | Matthew Littler | 928 | 33.9 | +19.4 | |
| UKIP | Derek Wunderley | 232 | 8.5 | -24.9 | |
| Liberal Democrats | Rosalind Harasiwka | 113 | 4.1 | +0.6 | |
| Green | James Tomkinson | 82 | 3.0 | +0.3 | |
| Majority | 451 | 16.5 | +4.0 | ||
| Turnout | 2,734 | 31.0 | -4.3 | ||
| Labour hold | Swing | UKIP to Conservative 22.1 | |||
Westhoughton North and Chew Moor ward
| Party | Candidate | Votes | % | ±% | |
|---|---|---|---|---|---|
| Conservative | Martyn Cox | 1,831 | 42.6 | +3.6 | |
| Liberal Democrats | Bernadette Eckersley-Fallon | 1,386 | 32.2 | +23.4 | |
| Labour | Ged Carter | 784 | 18.2 | -14.3 | |
| Independent | Jack Speight | 236 | 5.5 | +5.5 | |
| Green | Heather Rylance | 61 | 2.6 | -0.2 | |
| Majority | 445 | 10.5 | +4.1 | ||
| Turnout | 4,300 | 39.7 | +1.2 | ||
| Conservative hold | Swing | UKIP to Lib Dem 20.2 | |||
Westhoughton South ward
| Party | Candidate | Votes | % | ±% | |
|---|---|---|---|---|---|
| Liberal Democrats | David Wilkinson | 1,934 | 53.2 | +24.2 | |
| Labour | Ryan Battersby | 899 | 24.7 | -8.0 | |
| Conservative | Martin Tighe | 804 | 22.1 | +1.8 | |
| Majority | 1,035 | 28.4 | |||
| Turnout | 3,637 | 37.0 | +1.2 | ||
| Liberal Democrats gain from Labour | Swing | UKIP to Lib Dem 21.1 | |||
References
- "Notices and results: local election May 2018". bolton.gov.uk. Bolton Council. Retrieved 22 April 2018.
- "Four seats keep Labour in control at town hall". The Bolton News. 5 May 2018. pp. 4–5.
This article is issued from Wikipedia. The text is licensed under Creative Commons - Attribution - Sharealike. Additional terms may apply for the media files.