2014 Salford City Council election
The 2014 Salford City Council election took place on 22 May 2014 to elect members of Salford City Council in England.[1] This was on the same day as other local elections.
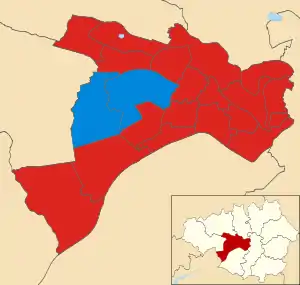
Map of the results of the 2014 Salford council election. Labour in red and Conservatives in blue.
The composition of the Council following the 2014 elections:
| Party | Seats | ± | |
|---|---|---|---|
| Labour | 52 | 0 | |
| Conservative | 8 | 0 | |
Ward results
Asterisks denote incumbent Councillors seeking re-election.
Barton ward
| Party | Candidate | Votes | % | ±% | |
|---|---|---|---|---|---|
| Labour | David Henry Jolley | 1,534 | 61.0 | ||
| Conservative | Hilary Brunyee | 498 | 19.8 | ||
| TUSC | Susan Katrina Wright | 484 | 19.2 | ||
| Majority | 1036 | 41.2 | |||
| Turnout | 2516 | ||||
| Labour hold | Swing | ||||
Boothstown & Ellenbrook ward
| Party | Candidate | Votes | % | ±% | |
|---|---|---|---|---|---|
| Conservative | Jillian Collinson* | 1,117 | 42.1 | ||
| Labour | Mike Pevitt | 723 | 27.3 | ||
| UKIP | David Wibberley | 554 | 20.9 | ||
| Green | Diana Joy Battersby | 258 | 9.7 | ||
| Majority | 394 | 14.9 | |||
| Turnout | 2,652 | ||||
| Conservative hold | Swing | ||||
Broughton ward
| Party | Candidate | Votes | % | ±% | |
|---|---|---|---|---|---|
| Labour | John Merry* | 1,662 | 59.9 | ||
| UKIP | Chavi Odze | 685 | 24.7 | ||
| Green | David Jones | 189 | 6.8 | ||
| Conservative | Glenis Purcell | 183 | 6.6 | ||
| TUSC | Alan Paul Metcalfe | 57 | 2.1 | ||
| Majority | 977 | 35.2 | |||
| Turnout | 2,776 | ||||
| Labour hold | Swing | ||||
Cadishead ward
| Party | Candidate | Votes | % | ±% | |
|---|---|---|---|---|---|
| Labour | Christine Hudson | 1,353 | 65.6 | +33.5 | |
| Conservative | Dorothy Chapman | 519 | 21.1 | ||
| BNP | Brenda Leather | 397 | 16.2 | ||
| TUSC | Diane Natalie Cawood | 187 | 7.6 | ||
| Majority | 834 | 34.0 | |||
| Turnout | 2456 | ||||
| Labour hold | Swing | ||||
Claremont ward
| Party | Candidate | Votes | % | ±% | |
|---|---|---|---|---|---|
| Labour | Sareda Dirir | 1,230 | 41.9 | ||
| UKIP | Mary Ferrer | 904 | 30.8 | ||
| Conservative | Bob Goodall | 446 | 15.2 | ||
| Green | Rene Iacopini | 163 | 5.5 | ||
| Liberal Democrats | Ronnie Benjamin | 142 | 4.8 | ||
| TUSC | Matthew David Kilsby | 52 | 1.8 | ||
| Majority | 326 | 11.1 | |||
| Turnout | 2,937 | 34.91 | |||
| Labour hold | Swing | ||||
Eccles ward
| Party | Candidate | Votes | % | ±% | |
|---|---|---|---|---|---|
| Labour | Michael Joseph Wheeler | 1,861 | 62.6 | ||
| Conservative | Julie Fensome | 827 | 27.8 | ||
| Liberal Democrats | Val Kelly | 287 | 9.6 | ||
| Majority | 1034 | 34.8 | |||
| Turnout | 2975 | ||||
| Labour hold | Swing | ||||
Irlam ward
| Party | Candidate | Votes | % | ±% | |
|---|---|---|---|---|---|
| Labour Co-op | Roger Jones | 1,177 | 56.4 | ||
| Conservative | Noel Gaskell | 393 | 18.8 | ||
| Reality Party | Jackie Anderson | 370 | 17.7 | ||
| Independent | Glenn Croston | 147 | 7.0 | ||
| Majority | 784 | 37.6 | |||
| Turnout | 2087 | ||||
| Labour Co-op hold | Swing | ||||
Irwell Riverside ward
| Party | Candidate | Votes | % | ±% | |
|---|---|---|---|---|---|
| Labour | Jane Elizabeth Hamilton | 1,044 | 49.3 | ||
| UKIP | Janice Taylor | 464 | 21.9 | ||
| Green | Emma Sarah Louise Van Dyke | 233 | 11.0 | ||
| Conservative | Helen Vaudrey | 194 | 9.2 | ||
| TUSC | Graham Cooper | 110 | 5.2 | ||
| BNP | Gary Tumulty | 73 | 3.4 | ||
| Majority | 580 | 27.4 | |||
| Turnout | 2118 | ||||
| Labour hold | Swing | ||||
Kersal ward
| Party | Candidate | Votes | % | ±% | |
|---|---|---|---|---|---|
| Labour | Ann-Marie Humphreys | 1,549 | 54.7 | ||
| UKIP | Shneur Zalman Odze | 781 | 27.6 | ||
| Conservative | Christopher Davies | 504 | 17.8 | ||
| Majority | 768 | 27.1 | |||
| Turnout | 2834 | ||||
| Labour hold | Swing | ||||
Langworthy ward
| Party | Candidate | Votes | % | ±% | |
|---|---|---|---|---|---|
| Labour | John David Warmisham | 1,250 | 57.9 | ||
| UKIP | Andy Olsen | 884 | 40.9 | ||
| Conservative | Arnold Saunders | 207 | 9.6 | ||
| BNP | Kay Pollitt | 86 | 4.0 | ||
| Motorcycle Alliance Party | Mike Yarwood | 50 | 2.3 | ||
| Majority | 366 | 17.0 | |||
| Turnout | 2,159 | 22.8 | −2.1 | ||
| Labour hold | Swing | ||||
Little Hulton ward
| Party | Candidate | Votes | % | ±% | |
|---|---|---|---|---|---|
| Labour | Eric Burgoyne | 1,331 | 60.7 | ||
| TUSC | Terry Simmons | 460 | 21.0 | ||
| Conservative | Alexandra Paterson | 401 | 18.3 | ||
| Majority | 871 | 39.7 | |||
| Turnout | 2192 | ||||
| Labour hold | Swing | ||||
Ordsall ward
| Party | Candidate | Votes | % | ±% | |
|---|---|---|---|---|---|
| Labour | Tanya Burch | 1,468 | 55.4 | ||
| Green | Jim Alayo-Arnabat | 518 | 19.6 | ||
| Conservative | Nicolette Turner | 457 | 17.3 | ||
| TUSC | Sally Griffiths | 206 | 7.8 | ||
| Majority | 950 | 35.9 | |||
| Turnout | 2649 | ||||
| Labour hold | Swing | ||||
Pendlebury ward
| Party | Candidate | Votes | % | ±% | |
|---|---|---|---|---|---|
| Labour | Bernard James Lea | 1,360 | 49.2 | ||
| UKIP | Paul Frank Doyle | 872 | 31.5 | ||
| Conservative | James William Ian Macdonald | 410 | 14.8 | ||
| BNP | Eddy O'Sullivan | 122 | 4.4 | ||
| Majority | 488 | 17.7 | |||
| Turnout | 2764 | ||||
| Labour hold | Swing | ||||
Swinton North ward
| Party | Candidate | Votes | % | ±% | |
|---|---|---|---|---|---|
| Labour | Bill Hinds | 1,336 | 49.5 | ||
| UKIP | Glyn Alan Wright | 770 | 28.5 | ||
| Conservative | Sharon Bulmer | 479 | 17.7 | ||
| English Democrat | Paul Officer | 115 | 4.3 | ||
| Majority | 566 | 21.0 | |||
| Turnout | 2700 | ||||
| Labour hold | Swing | ||||
Swinton South ward
| Party | Candidate | Votes | % | ±% | |
|---|---|---|---|---|---|
| Labour | Howard Saul Balkind | 1,004 | 41.5 | ||
| UKIP | Joe O'Neill | 874 | 36.1 | ||
| Conservative | Anne Broomhead | 435 | 18.0 | ||
| TUSC | Steve Cullen | 108 | 4.5 | ||
| Majority | 130 | 5.4 | |||
| Turnout | 2421 | ||||
| Labour hold | Swing | ||||
Walkden North ward
| Party | Candidate | Votes | % | ±% | |
|---|---|---|---|---|---|
| Labour Co-op | Adrian Brocklehurst* | 1,144 | 48.6 | -2.3 | |
| UKIP | Bernard Gill | 717 | 30.5 | N/A | |
| Conservative | Daniel Hill | 261 | 11.1 | -10.8 | |
| Green | Tom Dylan | 116 | 4.9 | N/A | |
| English Democrat | Laurence Depares | 84 | 3.6 | -6.1 | |
| Independent | Paul Stephen Woodburn | 31 | 1.3 | N/A | |
| Majority | 427 | 18.1 | -10.9 | ||
| Turnout | |||||
| Labour hold | Swing | -2.3 | |||
Walkden South ward
| Party | Candidate | Votes | % | ±% | |
|---|---|---|---|---|---|
| Conservative | Les Turner* | 1,186 | 38 | +0.1 | |
| Labour | Robert Andrew Sharpe | 1,105 | 35.5 | +1.5 | |
| UKIP | Albert Redshaw | 626 | 20.1 | N/A | |
| Green | Matthew J R Clark | 145 | 4.7 | N/A | |
| English Democrat | Paul Whitelegg | 55 | 1.8 | -2 | |
| Majority | 81 | 2.6 | -1.3 | ||
| Turnout | |||||
| Conservative hold | Swing | ||||
Weaste & Seedley ward
| Party | Candidate | Votes | % | ±% | |
|---|---|---|---|---|---|
| Labour Co-op | Ronnie Wilson | 1,401 | 57.0 | ||
| Conservative | Adam Kennaugh | 578 | 23.4 | ||
| TUSC | Paul Quinn | 486 | 19.7 | ||
| Majority | 823 | 33.4 | |||
| Turnout | 2465 | ||||
| Labour Co-op hold | Swing | ||||
Winton ward
| Party | Candidate | Votes | % | ±% | |
|---|---|---|---|---|---|
| Labour | Margaret Morris | 1,363 | 52.1 | ||
| Independent | Paul Doyle | 527 | 20.1 | ||
| Conservative | Andrew Darlington | 405 | 15.5 | ||
| BNP | Wayne Tomlinson | 323 | 8.9 | ||
| Majority | 836 | 31.9 | |||
| Turnout | 2618 | ||||
| Labour hold | Swing | ||||
Worsley ward
| Party | Candidate | Votes | % | ±% | |
|---|---|---|---|---|---|
| Conservative | Graham Compton* | 1,520 | 48.9 | -4.3 | |
| Labour | Amy Coffey | 718 | 23.1 | -3.8 | |
| UKIP | Andrew Townsend | 609 | 19.6 | N/A | |
| Green | Christopher Bertenshow | 262 | 8.4 | N/A | |
| Majority | 802 | 28.8 | -27.4 | ||
| Turnout | |||||
| Conservative hold | Swing | ||||
References
This article is issued from Wikipedia. The text is licensed under Creative Commons - Attribution - Sharealike. Additional terms may apply for the media files.