2019 Bury Metropolitan Borough Council election
The 2019 Bury Metropolitan Borough Council Election took place on 2 May 2019 to elect members of Bury Metropolitan Borough Council. This was on the same day as other local elections.
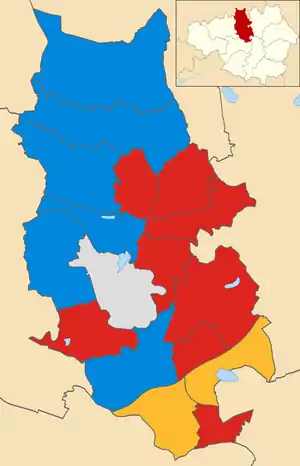
2019 local election results in Bury
Election result
Changes compared with 2018 election.
| 2019 Bury Metropolitan Borough Council election[1] | ||||||||||
|---|---|---|---|---|---|---|---|---|---|---|
| Party | This election | Full council | This election | |||||||
| Seats | Net | Seats % | Other | Total | Total % | Votes | Votes % | +/− | ||
| Labour | 8 | 52.3 | 20 | 29 | 56.9 | 19,508 | 38.9 | -9.3 | ||
| Conservative | 6 | 29.4 | 11 | 16 | 31.4 | 17,442 | 34.8 | -3.0 | ||
| Liberal Democrats | 2 | 11.8 | 2 | 4 | 7.8 | 6,351 | 12.7 | +3.0 | ||
| Independent | 1 | 5.9 | 1 | 2 | 3.9 | 1,851 | 3.7 | +2.8 | ||
| Green | 0 | 0.0 | 0 | 0 | 0.0 | 4,370 | 8.7 | +5.4 | ||
| UKIP | 0 | 0.0 | 0 | 0 | 0.0 | 354 | 0.7 | New | ||
| English Democrat | 0 | 0.0 | 0 | 0 | 0.0 | 288 | 0.6 | +0.3 | ||
Ward results
Candidates seeking re-election were last elected in 2015 and are denoted with an asterisk. Changes are compared to the 2018 results in that ward.
Besses
| Party | Candidate | Votes | % | ±% | |
|---|---|---|---|---|---|
| Labour | Andrea Simpson | 1,007 | 48.3 | -11.4 | |
| Conservative | Jordan Lewis | 433 | 20.8 | -2.5 | |
| English Democrat | Stephen Morris | 288 | 13.8 | +6.7 | |
| Green | Jessie Georgia Smart | 197 | 9.5 | +4.5 | |
| Liberal Democrats | Dominic Bairstow Jackson | 158 | 7.6 | +2.7 | |
| Majority | 574 | 27.6 | |||
| Turnout | 2,083 | 25.4 | |||
| Labour hold | Swing | ||||
Church
| Party | Candidate | Votes | % | ±% | |
|---|---|---|---|---|---|
| Conservative | Jackie Harris* | 1,913 | 56.7 | -1.9 | |
| Labour | Sam Turner | 925 | 27.4 | -8.4 | |
| Green | Nicole Paule Haydock | 338 | 10.0 | +4.4 | |
| Liberal Democrats | Lynda Arthur | 198 | 5.9 | New | |
| Majority | 988 | 29.3 | |||
| Turnout | 3,374 | 40.2 | |||
| Conservative hold | Swing | ||||
East
| Party | Candidate | Votes | % | ±% | |
|---|---|---|---|---|---|
| Labour | Gavin McGill | 1,418 | 63.6 | +4.2 | |
| Conservative | Liam James Dean | 428 | 19.2 | -14.9 | |
| Green | Paul Anthony Petzer | 261 | 11.7 | +5.1 | |
| Liberal Democrats | Stephen Stokes | 124 | 5.6 | New | |
| Majority | 990 | 44.4 | |||
| Turnout | 2,231 | 26.6 | |||
| Labour hold | Swing | ||||
Elton
| Party | Candidate | Votes | % | ±% | |
|---|---|---|---|---|---|
| Labour | Charlotte Morris | 1,259 | 42.2 | -8.6 | |
| Conservative | Michael Hankey* | 1,243 | 41.6 | -2.0 | |
| Green | Charlie Allen | 351 | 11.8 | +8.1 | |
| Liberal Democrats | Jacob Royde | 133 | 4.5 | +2.6 | |
| Majority | 16 | 0.5 | |||
| Turnout | 2,986 | 35.56 | |||
| Labour gain from Conservative | Swing | ||||
Holyrood
| Party | Candidate | Votes | % | ±% | |
|---|---|---|---|---|---|
| Liberal Democrats | Maria Tegolo | 1,995 | 56.1 | +9.4 | |
| Labour | Chris Neville | 1,009 | 28.4 | -9.9 | |
| UKIP | Kevin McGill | 196 | 5.5 | New | |
| Green | Peter Curati | 179 | 5.0 | +1.4 | |
| Conservative | Bernard Vincent | 177 | 5.0 | -6.4 | |
| Majority | 986 | 27.7 | |||
| Turnout | 3,556 | 41.6 | |||
| Liberal Democrats hold | Swing | ||||
Moorside
| Party | Candidate | Votes | % | ±% | |
|---|---|---|---|---|---|
| Labour | Sarah Southworth* | 1,198 | 47.1 | -19.1 | |
| Conservative | Sohail Raja | 829 | 32.6 | +8.3 | |
| Green | Stefanie Jayne Moore | 391 | 15.4 | +10.8 | |
| Liberal Democrats | Gavin Warnes | 123 | 4.8 | New | |
| Majority | 369 | 14.5 | |||
| Turnout | 2,571 | 28.7 | |||
| Labour hold | Swing | ||||
No Independent candidate as previous (-4.9).
North Manor
| Party | Candidate | Votes | % | ±% | |
|---|---|---|---|---|---|
| Conservative | Khalid Hussain* | 1,699 | 50.3 | -11.0 | |
| Labour | Tom Pilkington | 942 | 27.9 | -3.9 | |
| Green | Mary Heath | 456 | 13.5 | +10.3 | |
| Liberal Democrats | Ewan Arthur | 284 | 8.4 | +4.7 | |
| Majority | 757 | 22.4 | |||
| Turnout | 3,381 | 42.1 | |||
| Conservative hold | Swing | ||||
Pilkington Park
| Party | Candidate | Votes | % | ±% | |
|---|---|---|---|---|---|
| Conservative | Robert Caserta* | 1,482 | 49.6 | -7.4 | |
| Labour | Eddy Redmond | 951 | 31.8 | -4.8 | |
| Liberal Democrats | Andrew Cross | 202 | 6.8 | +4.2 | |
| Green | Myriam Salama-Carr | 193 | 6.5 | +2.7 | |
| UKIP | Anthony Clough | 158 | 5.3 | New | |
| Majority | 531 | 17.8 | |||
| Turnout | 2,986 | 39.9 | |||
| Conservative hold | Swing | ||||
Radcliffe East
| Party | Candidate | Votes | % | ±% | |
|---|---|---|---|---|---|
| Independent | James Mason | 1,045 | 38.1 | New | |
| Labour | Evelyn Mary Doyle | 979 | 35.7 | -11.4 | |
| Conservative | Luis James McBriar | 609 | 22.2 | -7.0 | |
| Liberal Democrats | Stephen Thomas Lewis | 110 | 4.0 | -2.6 | |
| Majority | 66 | 2.4 | |||
| Turnout | 2,743 | 30.8 | |||
| Independent gain from Labour | Swing | ||||
No Independent candidate as previous (-13.2).
Radcliffe North
| Party | Candidate | Votes | % | ±% | |
|---|---|---|---|---|---|
| Conservative | Sam Hurst | 1,507 | 48.6 | -6.5 | |
| Labour | Jamie Walker* | 1,171 | 37.8 | -2.8 | |
| Green | John Philip Meara | 301 | 9.7 | New | |
| Liberal Democrats | Rodney Rew | 120 | 3.9 | -0.4 | |
| Majority | 336 | 10.8 | |||
| Turnout | 3,099 | 35.8 | |||
| Conservative gain from Labour | Swing | ||||
Radcliffe West
| Party | Candidate | Votes | % | ±% | |
|---|---|---|---|---|---|
| Labour | Beth Mortenson | 886 | 39.2 | -21.3 | |
| Independent | Carol Ann Birchmore | 806 | 35.7 | New | |
| Conservative | David Lewis | 350 | 15.5 | -9.5 | |
| Green | Andrew Truelove | 152 | 6.7 | -4.7 | |
| Liberal Democrats | Kamran Islam | 65 | 2.9 | -0.1 | |
| Majority | 80 | 3.5 | |||
| Turnout | 2,259 | 26.8 | |||
| Labour hold | Swing | ||||
Ramsbottom
| Party | Candidate | Votes | % | ±% | |
|---|---|---|---|---|---|
| Labour | Clair Ann Cummins | 1,645 | 45.3 | -6.4 | |
| Conservative | Gregg Dennis Fletcher | 1,459 | 40.2 | -4.7 | |
| Green | Louise Stephanie Bancroft | 363 | 10.0 | New | |
| Liberal Democrats | David Henry Foss | 160 | 4.4 | +1.1 | |
| Majority | 186 | 5.1 | |||
| Turnout | 3,627 | 40.3 | |||
| Labour gain from Conservative | Swing | ||||
Redvales
| Party | Candidate | Votes | % | ±% | |
|---|---|---|---|---|---|
| Labour | Clare Louise Walsh | 1,511 | 47.2 | -17.2 | |
| Conservative | Shahbaz Mahmood Arif | 1,213 | 37.9 | +11.5 | |
| Green | Paul Johnstone | 349 | 10.9 | +5.4 | |
| Liberal Democrats | Gareth Lloyd-Johnson | 128 | 4.0 | +0.3 | |
| Majority | 298 | 9.3 | |||
| Turnout | 3,201 | 35.4 | |||
| Labour hold | Swing | ||||
Sedgley
| Party | Candidate | Votes | % | ±% | |
|---|---|---|---|---|---|
| Labour | Richard Ian Gold | 1,650 | 54.9 | -5.3 | |
| Conservative | Daniel Kallmunzer | 1,010 | 33.6 | -0.1 | |
| Liberal Democrats | Elena Lenzi | 347 | 11.5 | +5.4 | |
| Majority | 640 | 21.3 | |||
| Turnout | 3,007 | 33.99 | |||
| Labour hold | Swing | ||||
St. Mary's
| Party | Candidate | Votes | % | ±% | |
|---|---|---|---|---|---|
| Liberal Democrats | Michael Powell | 1,964 | 56.7 | +12.7 | |
| Labour | Noel Bayley* | 1,022 | 29.5 | -16.1 | |
| Conservative | Zadok Day | 266 | 7.7 | -2.7 | |
| Green | Emlyn Martin Begley | 214 | 6.2 | New | |
| Majority | 942 | 27.2 | |||
| Turnout | 3,466 | 42.8 | |||
| Liberal Democrats gain from Labour | Swing | ||||
Tottington
| Party | Candidate | Votes | % | ±% | |
|---|---|---|---|---|---|
| Conservative | Yvonne Wright* | 1,729 | 58.2 | +4.8 | |
| Labour | Anthony McCaul | 764 | 25.7 | -14.1 | |
| Green | Samantha Deas | 354 | 11.9 | New | |
| Liberal Democrats | Andy Minty | 125 | 4.2 | +1.3 | |
| Majority | 965 | 32.5 | |||
| Turnout | 2,972 | 37.3 | |||
| Conservative hold | Swing | ||||
Unsworth
| Party | Candidate | Votes | % | ±% | |
|---|---|---|---|---|---|
| Labour | Joan Grimshaw* | 1,171 | 44.2 | +0.1 | |
| Conservative | Anton Slawycz | 1,095 | 41.3 | +6.2 | |
| Green | Glyn Harvey Heath | 271 | 10.2 | New | |
| Liberal Democrats | Ugonna Edeoga | 115 | 4.3 | -16.5 | |
| Majority | 76 | 2.9 | |||
| Turnout | 2,652 | 36.3 | |||
| Labour hold | Swing | ||||
References
- "Local Election Results 2019". Bury Metropolitan Borough Council. Bury Metropolitan Borough Council. Retrieved 3 July 2019.
This article is issued from Wikipedia. The text is licensed under Creative Commons - Attribution - Sharealike. Additional terms may apply for the media files.