2019 High Peak Borough Council election
The 2019 High Peak Borough Council election took place on 2 May 2019 to elect all 43 members of High Peak Borough Council in Derbyshire, England.
| |||||||||||||||||||||||||||||||||||||||||||||||||||||
All 43 seats to High Peak Borough Council 22 seats needed for a majority | |||||||||||||||||||||||||||||||||||||||||||||||||||||
|---|---|---|---|---|---|---|---|---|---|---|---|---|---|---|---|---|---|---|---|---|---|---|---|---|---|---|---|---|---|---|---|---|---|---|---|---|---|---|---|---|---|---|---|---|---|---|---|---|---|---|---|---|---|
| |||||||||||||||||||||||||||||||||||||||||||||||||||||
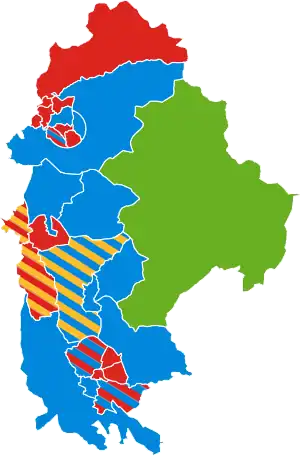 Map of the results of the election | |||||||||||||||||||||||||||||||||||||||||||||||||||||
| |||||||||||||||||||||||||||||||||||||||||||||||||||||
The election resulted in the Labour Party taking control of the council from the Conservative Party after winning 22 of the 43 seats up for election. The Conservatives lost 7 of the seats they were defending and lost their majority on the council. The Liberal Democrats and Greens won 3 and 2 seats respectively.[1][2]
Summary
After the election, the composition of the council was:
- Labour 22
- Conservative 16
- Liberal Democrat 3
- Green 2
Election result
| 2019 High Peak Borough Council election | ||||||||||
|---|---|---|---|---|---|---|---|---|---|---|
| Party | Candidates | Seats | Gains | Losses | Net gain/loss | Seats % | Votes % | Votes | +/− | |
| Labour | 37 | 22 | 5 | 0 | 51.2 | 34.9 | 15,940 | –0.9 | ||
| Conservative | 43 | 16 | 0 | 7 | 37.2 | 33.2 | 15,115 | –4.7 | ||
| Liberal Democrats | 22 | 3 | 1 | 0 | 7.0 | 14.9 | 6,805 | +6.9 | ||
| Green | 26 | 2 | 2 | 0 | 4.7 | 15.1 | 6,874 | +7.0 | ||
| UKIP | 4 | 0 | 0 | 0 | 0.0 | 1.1 | 505 | –3.3 | ||
| Independent | 1 | 0 | 0 | 0 | 0.0 | 0.8 | 368 | –5.1 | ||
Ward results
| Party | Candidate | Votes | % | ±% | |
|---|---|---|---|---|---|
| Labour | Rachael Quinn | 223 | 48.9 | 3.9 | |
| Conservative | Sebastian Brooke | 155 | 34.0 | -3.5 | |
| Green | Daniel Mayers | 78 | 17.1 | 17.1 | |
| Majority | 68 | 14.9 | 7.7 | ||
| Turnout | 456 | 32.98 | -30.52 | ||
| Labour hold | Swing | ||||
| Party | Candidate | Votes | % | ±% | |
|---|---|---|---|---|---|
| Liberal Democrats | Edith Claire Longden | 607 | 37.5 | ||
| Conservative | Eve Burton | 571 | 35.2 | ||
| Conservative | John Kappes | 519 | 32.0 | ||
| Labour | Penny Took | 484 | 29.9 | ||
| Liberal Democrats | Graham Hewitt | 443 | 27.3 | ||
| Green | Joshua Bennett | 342 | 21.1 | ||
| Turnout | 1620 | 46.19 | -30.11 | ||
| Liberal Democrats gain from Conservative | Swing | ||||
| Conservative hold | Swing | ||||
| Party | Candidate | Votes | % | ±% | |
|---|---|---|---|---|---|
| Conservative | Samantha Flower | 232 | 43.2 | -6.3 | |
| Labour | Anthony Glew | 175 | 32.6 | 5.4 | |
| Green | Ivor Lewis | 130 | 24.2 | 24.2 | |
| Majority | 57 | 10.6 | -12.1 | ||
| Turnout | 537 | 34.4 | -37.4 | ||
| Conservative hold | Swing | ||||
| Party | Candidate | Votes | % | ±% | |
|---|---|---|---|---|---|
| Labour | Matt Stone | 651 | 59.1 | ||
| Labour | Jean Todd | 586 | 53.2 | ||
| Green | Eileen Reynolds | 302 | 27.4 | ||
| Conservative | Alicia Hill | 275 | 25.0 | ||
| Conservative | Josh Kirkman | 235 | 21.3 | ||
| Turnout | 1101 | 37.42 | |||
| Labour hold | Swing | ||||
| Labour hold | Swing | ||||
| Party | Candidate | Votes | % | ±% | |
|---|---|---|---|---|---|
| Conservative | Jim Perkins | 253 | 43.2 | ||
| Labour | Jim Lambert | 195 | 33.3 | ||
| Green | Jeremy Wight | 72 | 12.3 | ||
| Liberal Democrats | James Patterson | 65 | 11.1 | ||
| Majority | |||||
| Turnout | 585 | 35.19 | |||
| Conservative hold | Swing | ||||
| Party | Candidate | Votes | % | ±% | |
|---|---|---|---|---|---|
| Conservative | Kathleen Sizeland | 656 | 43.7 | ||
| Conservative | Stewart Paul Young | 522 | 34.8 | ||
| Labour | Jessica Cowley | 391 | 26.0 | ||
| Independent | Paddy Bann | 368 | 24.5 | ||
| Labour | Adrian Cowley | 342 | 22.8 | ||
| Liberal Democrats | David Rayworth | 208 | 13.9 | ||
| Green | Philip Taylor | 201 | 13.4 | ||
| Turnout | 1501 | 38.62 | |||
| Conservative hold | Swing | ||||
| Conservative hold | Swing | ||||
| Party | Candidate | Votes | % | ±% | |
|---|---|---|---|---|---|
| Conservative | Tony Arthur Kemp | 445 | 35.4 | ||
| Labour | Madeline Hall | 435 | 34.6 | ||
| Green | Peter Crook | 420 | 33.4 | ||
| Conservative | Pam Reddy | 388 | 30.8 | ||
| Liberal Democrats | Adam Scott | 306 | 24.3 | ||
| Liberal Democrats | Stan Heptinstall | 266 | 21.1 | ||
| Turnout | 1258 | 39.26 | |||
| Conservative hold | Swing | ||||
| Labour gain from Conservative | Swing | ||||
| Party | Candidate | Votes | % | ±% | |
|---|---|---|---|---|---|
| Conservative | Linda Grooby | 477 | 47.8 | ||
| Labour | Keith Edward Savage | 475 | 47.6 | ||
| Labour | Catherine Grundy-Glew | 452 | 45.3 | ||
| Conservative | Laszlo Gyongyosi | 407 | 40.8 | ||
| Turnout | 998 | 31.72 | |||
| Conservative hold | Swing | ||||
| Labour gain from Conservative | Swing | ||||
| Party | Candidate | Votes | % | ±% | |
|---|---|---|---|---|---|
| Conservative | Jean Wharmby | 361 | 43.3 | ||
| Labour | Ray Collins | 262 | 31.5 | ||
| Green | Holly McBride | 120 | 14.4 | ||
| Liberal Democrats | Stephen Worrall | 90 | 10.8 | ||
| Majority | |||||
| Turnout | 833 | 46.97 | |||
| Conservative hold | Swing | ||||
| Party | Candidate | Votes | % | ±% | |
|---|---|---|---|---|---|
| Labour | Anthony Edward McKeown | 306 | 84.8 | ||
| Conservative | Matthew Crompton | 55 | 15.2 | ||
| Majority | |||||
| Turnout | 361 | 21.98 | |||
| Labour hold | Swing | ||||
| Party | Candidate | Votes | % | ±% | |
|---|---|---|---|---|---|
| Labour | Ed Kelly | 242 | 55.7 | ||
| Green | Robyn Summers | 110 | 25.3 | ||
| Conservative | Lisa Hartington | 82 | 18.9 | ||
| Majority | |||||
| Turnout | 434 | 25.77 | |||
| Labour hold | Swing | ||||
| Party | Candidate | Votes | % | ±% | |
|---|---|---|---|---|---|
| Labour | Edward Siddall | 543 | 49.5 | ||
| Labour | Bob McKeown | 506 | 46.1 | ||
| Conservative | Peter Lynas | 250 | 22.8 | ||
| Conservative | Bev Haigh | 237 | 21.6 | ||
| Green | Peter Tomlin | 212 | 19.3 | ||
| UKIP | Jo Shaw | 137 | 12.5 | ||
| Liberal Democrats | Keith Parry | 133 | 12.1 | ||
| Turnout | 1097 | 32.78 | |||
| Labour hold | Swing | ||||
| Labour hold | Swing | ||||
| Party | Candidate | Votes | % | ±% | |
|---|---|---|---|---|---|
| Conservative | Eva Lawson | 300 | 37.6 | ||
| Labour | Catherine Hughes | 287 | 36.0 | ||
| Liberal Democrats | David Burfoot | 124 | 15.5 | ||
| Green | Susan Shipley | 87 | 10.9 | ||
| Majority | |||||
| Turnout | 798 | 48.5 | |||
| Conservative hold | Swing | ||||
| Party | Candidate | Votes | % | ±% | |
|---|---|---|---|---|---|
| Green | Charlotte Nancy Farrell | 777 | 45.9 | ||
| Green | Joanna Collins | 744 | 44.0 | ||
| Conservative | Frederick John Walton | 728 | 43.0 | ||
| Conservative | Charles Lawley | 708 | 41.8 | ||
| Liberal Democrats | Jane Simm | 226 | 13.4 | ||
| Turnout | 1692 | 53.92 | |||
| Green gain from Conservative | Swing | ||||
| Green gain from Conservative | Swing | ||||
| Party | Candidate | Votes | % | ±% | |
|---|---|---|---|---|---|
| Labour | Damien Greenhalgh | 761 | 59.8 | ||
| Labour | Rachel Abbotts | 688 | 54.0 | ||
| Green | Robert Hodgetts-Haley | 355 | 27.9 | ||
| Conservative | Peter Kay | 191 | 15.0 | ||
| Liberal Democrats | Mark Smitham | 170 | 13.4 | ||
| Conservative | Dominic Starkey | 144 | 11.3 | ||
| Turnout | 1273 | 36.08 | |||
| Labour hold | Swing | ||||
| Labour hold | Swing | ||||
| Party | Candidate | Votes | % | ±% | |
|---|---|---|---|---|---|
| Conservative | Peter Roberts | 320 | 57.1 | ||
| Labour | Caitlin Bisknell | 147 | 26.3 | ||
| Green | Daniel Wimberley | 93 | 16.6 | ||
| Majority | |||||
| Turnout | 560 | ||||
| Conservative hold | Swing | ||||
| Party | Candidate | Votes | % | ±% | |
|---|---|---|---|---|---|
| Labour | Ian Samuel Edward Huddlestone | 421 | 43.9 | ||
| Labour | Alan Barrow | 411 | 42.9 | ||
| Liberal Democrats | Beth Atkins | 350 | 36.5 | ||
| Conservative | Pam Ashton | 186 | 19.4 | ||
| Green | Dee Sayce | 185 | 19.3 | ||
| UKIP | Jim Muldoon | 131 | 13.7 | ||
| Conservative | Virginia Priestly | 78 | 8.1 | ||
| Turnout | 958 | 30.99 | |||
| Labour hold | Swing | ||||
| Labour hold | Swing | ||||
| Party | Candidate | Votes | % | ±% | |
|---|---|---|---|---|---|
| Labour | Lancelot Edgar Dowson | 623 | 42.8 | ||
| Liberal Democrats | Raymond George Atkins | 552 | 37.9 | ||
| Labour | Anne Marie Clarke | 527 | 36.2 | ||
| Liberal Democrats | Chris Weaver | 320 | 22.0 | ||
| Green | Hazel Body | 318 | 21.8 | ||
| Conservative | Edward Sheils | 280 | 19.2 | ||
| Conservative | William Lockwood | 158 | 10.9 | ||
| Turnout | 1456 | 42.5 | |||
| Labour hold | Swing | ||||
| Liberal Democrats hold | Swing | ||||
| Party | Candidate | Votes | % | ±% | |
|---|---|---|---|---|---|
| Conservative | Jamie Douglas | 591 | 35.6 | ||
| Conservative | Paul Francis Hardy | 584 | 35.2 | ||
| Labour | Sheila Yamin | 549 | 33.1 | ||
| Labour | Pat Irwin | 500 | 30.1 | ||
| Green | Paul Bohan | 455 | 27.4 | ||
| Liberal Democrats | Kallen McColl | 360 | 21.7 | ||
| Turnout | 1659 | 44.55 | |||
| Conservative hold | Swing | ||||
| Conservative hold | Swing | ||||
| Party | Candidate | Votes | % | ±% | |
|---|---|---|---|---|---|
| Labour | Ollie Cross | 337 | 46.3 | ||
| Conservative | David Hartington | 249 | 34.2 | ||
| Green | Rachel Robinson | 142 | 19.5 | ||
| Majority | |||||
| Turnout | 728 | 39.9 | |||
| Labour hold | Swing | ||||
| Party | Candidate | Votes | % | ±% | |
|---|---|---|---|---|---|
| Conservative | Tony Ashton | 316 | 42.9 | ||
| Labour | Aaron Jones | 274 | 37.2 | ||
| Green | Michael John Shipley | 146 | 19.8 | ||
| Majority | |||||
| Turnout | 736 | 45.86 | |||
| Conservative hold | Swing | ||||
| Party | Candidate | Votes | % | ±% | |
|---|---|---|---|---|---|
| Labour | Stewart Gardner | 625 | 41.8 | ||
| Conservative | John Haken | 580 | 38.8 | ||
| Conservative | Julie Ann McCabe | 516 | 34.5 | ||
| Green | Melanie O’Brien | 319 | 21.4 | ||
| Liberal Democrats | Ayshea Christina Garbutt | 211 | 14.1 | ||
| UKIP | David Phillips | 164 | 11.0 | ||
| Liberal Democrats | Alistair Murray Booth | 117 | 7.8 | ||
| Turnout | 1494 | 43.75 | |||
| Labour gain from Conservative | Swing | ||||
| Conservative hold | Swing | ||||
| Party | Candidate | Votes | % | ±% | |
|---|---|---|---|---|---|
| Conservative | George David Wharmby | 283 | 52.8 | ||
| Labour | Kasey Carver | 180 | 33.6 | ||
| UKIP | Chris Boyle | 73 | 13.6 | ||
| Majority | |||||
| Turnout | 536 | 35.88 | |||
| Conservative hold | Swing | ||||
| Party | Candidate | Votes | % | ±% | |
|---|---|---|---|---|---|
| Labour | David Kerr | 438 | 53.5 | ||
| Labour | Fiona Sloman | 408 | 49.9 | ||
| Conservative | Elizabeth Hill | 210 | 25.7 | ||
| Conservative | David McDowell | 187 | 22.9 | ||
| Green | Guy Rees | 153 | 18.7 | ||
| Liberal Democrats | Lynton Bennett | 111 | 13.6 | ||
| Turnout | 818 | 25.58 | |||
| Labour hold | Swing | ||||
| Labour hold | Swing | ||||
| Party | Candidate | Votes | % | ±% | |
|---|---|---|---|---|---|
| Conservative | Emily Lilian Thrane | 364 | 44.0 | ||
| Labour | Tony Riddington | 261 | 31.6 | ||
| Green | Ben Evens | 202 | 24.4 | ||
| Majority | |||||
| Turnout | 827 | 46.8 | |||
| Conservative hold | Swing | ||||
| Party | Candidate | Votes | % | ±% | |
|---|---|---|---|---|---|
| Labour | Rob Baker | 336 | 50.7 | ||
| Conservative | Jill Crossland | 223 | 33.6 | ||
| Green | Luke Robinson | 104 | 15.7 | ||
| Majority | |||||
| Turnout | 663 | 41.7 | |||
| Labour hold | Swing | ||||
| Party | Candidate | Votes | % | ±% | |
|---|---|---|---|---|---|
| Liberal Democrats | David William Lomax | 901 | 40.4 | ||
| Labour | Kath Thomson | 790 | 35.4 | ||
| Labour | Shannon-Kate Thomson | 744 | 33.3 | ||
| Green | Lucas Jones | 726 | 32.5 | ||
| Conservative | Alison Fox | 686 | 30.7 | ||
| Conservative | Andrew Fox | 613 | 27.5 | ||
| Liberal Democrats | Andy Thomson | 613 | 27.5 | ||
| Liberal Democrats | Margaret Weaver | 570 | 25.5 | ||
| Conservative | Lesley Morgan | 448 | 20.1 | ||
| Turnout | 2231 | 43.12 | |||
| Liberal Democrats hold | Swing | ||||
| Labour gain from Independent | Swing | ||||
| Labour gain from Conservative | Swing | ||||
| Party | Candidate | Votes | % | ±% | |
|---|---|---|---|---|---|
| Labour | Graham Nigel Oakley | 365 | 60.8 | ||
| Conservative | Anne Ross Worrall | 92 | 15.3 | ||
| Green | Patricia Thompson | 81 | 13.5 | ||
| Liberal Democrats | Keith Braithwaite | 62 | 10.3 | ||
| Majority | |||||
| Turnout | 600 | 35.47 | |||
| Labour hold | Swing | ||||
By-elections
Cote Heath
| Party | Candidate | Votes | % | ±% | |
|---|---|---|---|---|---|
| Conservative | Frank Kirkham | 585 | 55.5 | +5.4 | |
| Labour | Alan Smith | 413 | 39.2 | -10.7 | |
| Green | Peter Crook | 56 | 5.3 | N/A | |
| Majority | 172 | 16.3 | |||
| Turnout | 1,056 | 32.6 | |||
| Conservative gain from Labour | Swing | ||||
References
- "High Peak Borough Council". BBC News. Retrieved 4 May 2019.
- "High Peak Local Election - Results". High Peak Borough Council. Archived from the original on 25 May 2019. Retrieved 25 June 2019.
This article is issued from Wikipedia. The text is licensed under Creative Commons - Attribution - Sharealike. Additional terms may apply for the media files.