1988 United States presidential election in Ohio
The 1988 United States presidential election in Ohio took place on November 8, 1988. All 50 states and the District of Columbia, were part of the 1988 United States presidential election. State voters chose 23 electors to the Electoral College, which selected the president and vice president.
| ||||||||||||||||||||||||||
| ||||||||||||||||||||||||||
 County Results
| ||||||||||||||||||||||||||
| ||||||||||||||||||||||||||
| Elections in Ohio |
|---|
.svg.png.webp) |
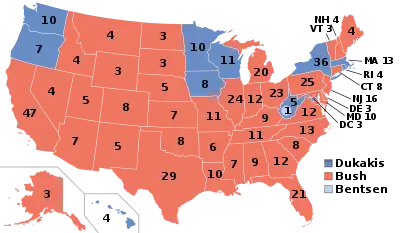
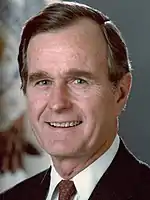
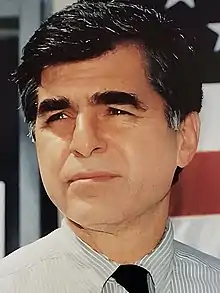
Ohio was won by incumbent United States Vice President George H. W. Bush of Texas, who was running against Massachusetts Governor Michael Dukakis. Bush ran with Indiana Senator Dan Quayle as vice president, and Dukakis ran with Texas Senator Lloyd Bentsen. As of 2020, this is the last time that Ohio was decided by double-digits.
Ohio weighed in for this election as 3% more Republican than the national average. This is the first election since 1924 in which Ohio did not vote the same way as Wisconsin, something that would reoccur in 2000, 2004, and 2020.
The presidential election of 1988 was a very partisan election for Ohio, with more than 99% of the electorate voting for either the Democratic or Republican parties.[1] Most counties in the state turned out more for Bush than Dukakis. Two notable exceptions to this trend were Cleveland's Cuyahoga County, and residents of several counties on the Eastern border with Pennsylvania, who voted largely for Dukakis. This was the last occasion until 2016 that Erie County, Montgomery County and Portage County voted for a Republican presidential candidate.[2]
Bush won the election in Ohio with a solid 11-point win. As a historical swing state, the decisive election results in Ohio were reflective of a nationwide reconsolidation of the base for the Republican Party, which took place through the 1980s. Through the passage of some very controversial economic programs, spearheaded by then President Ronald Reagan (called, collectively, "Reaganomics"), the mid-to-late 1980s saw a period of economic growth and stability. The hallmark of Reaganomics was, in part, the wide-scale deregulation of corporate interests, and tax cuts for the wealthy.[3] Dukakis ran on a socially liberal platform, and advocated for higher economic regulation and environmental protection. Bush, alternatively, ran on a campaign of continuing the social and economic policies of former President Reagan - which gained him much support with social conservatives and people living in rural areas.
Results
| 1988 United States presidential election in Ohio | |||||
|---|---|---|---|---|---|
| Party | Candidate | Votes | Percentage | Electoral votes | |
| Republican | George H. W. Bush | 2,416,549 | 55.00% | 23 | |
| Democratic | Michael Dukakis | 1,939,629 | 44.15% | 0 | |
| Not Designated | Lenora Fulani | 12,017 | 0.27% | 0 | |
| Not Designated | Ron Paul | 11,989 | 0.27% | 0 | |
| Not Designated | Lyndon LaRouche | 7,733 | 0.18% | 0 | |
| Not Designated | Edward Winn | 5,432 | 0.12% | 0 | |
| Write-Ins | 216 | >0.01% | 0 | ||
| Not Designated | Larry Holmes | 134 | >0.01% | 0 | |
| Totals | 4,393,699 | 100.0% | 23 | ||
Results by county
| County | George Herbert Walker Bush Republican |
Michael Stanley Dukakis Democratic |
Various candidates Other parties |
Margin | Total votes cast | ||||
|---|---|---|---|---|---|---|---|---|---|
| # | % | # | % | # | % | # | % | ||
| Adams | 5,916 | 60.71% | 3,740 | 38.38% | 88 | 0.90% | 2,176 | 22.33% | 9,744 |
| Allen | 31,021 | 68.97% | 13,727 | 30.52% | 227 | 0.50% | 17,294 | 38.45% | 44,975 |
| Ashland | 12,726 | 67.19% | 6,072 | 32.06% | 141 | 0.74% | 6,654 | 35.13% | 18,939 |
| Ashtabula | 17,654 | 45.79% | 20,536 | 53.26% | 366 | 0.95% | -2,882 | -7.47% | 38,556 |
| Athens | 9,314 | 45.92% | 10,795 | 53.23% | 172 | 0.85% | -1,481 | -7.30% | 20,281 |
| Auglaize | 13,562 | 73.39% | 4,756 | 25.74% | 161 | 0.87% | 8,806 | 47.65% | 18,479 |
| Belmont | 12,214 | 38.20% | 19,515 | 61.04% | 244 | 0.76% | -7,301 | -22.83% | 31,973 |
| Brown | 7,539 | 59.37% | 5,047 | 39.75% | 112 | 0.88% | 2,492 | 19.63% | 12,698 |
| Butler | 75,725 | 68.71% | 33,770 | 30.64% | 713 | 0.65% | 41,955 | 38.07% | 110,208 |
| Carroll | 6,179 | 56.20% | 4,667 | 42.45% | 148 | 1.35% | 1,512 | 13.75% | 10,994 |
| Champaign | 8,995 | 67.29% | 4,272 | 31.96% | 101 | 0.76% | 4,723 | 35.33% | 13,368 |
| Clark | 32,729 | 57.92% | 23,247 | 41.14% | 527 | 0.93% | 9,482 | 16.78% | 56,503 |
| Clermont | 37,417 | 70.49% | 15,352 | 28.92% | 316 | 0.60% | 22,065 | 41.57% | 53,085 |
| Clinton | 8,856 | 69.74% | 3,746 | 29.50% | 97 | 0.76% | 5,110 | 40.24% | 12,699 |
| Columbiana | 21,175 | 49.08% | 21,581 | 50.03% | 384 | 0.89% | -406 | -0.94% | 43,140 |
| Coshocton | 8,282 | 57.09% | 6,020 | 41.50% | 204 | 1.41% | 2,262 | 15.59% | 14,506 |
| Crawford | 12,472 | 66.70% | 6,018 | 32.18% | 210 | 1.12% | 6,454 | 34.51% | 18,700 |
| Cuyahoga | 242,439 | 40.33% | 353,401 | 58.79% | 5,277 | 0.88% | -110,962 | -18.46% | 601,117 |
| Darke | 14,914 | 67.93% | 6,851 | 31.21% | 189 | 0.86% | 8,063 | 36.73% | 21,954 |
| Defiance | 9,566 | 63.13% | 5,448 | 35.95% | 139 | 0.92% | 4,118 | 27.18% | 15,153 |
| Delaware | 20,693 | 72.61% | 7,590 | 26.63% | 215 | 0.75% | 13,103 | 45.98% | 28,498 |
| Erie | 16,670 | 51.77% | 15,097 | 46.89% | 431 | 1.34% | 1,573 | 4.89% | 32,198 |
| Fairfield | 29,208 | 69.46% | 12,504 | 29.74% | 339 | 0.81% | 16,704 | 39.72% | 42,051 |
| Fayette | 6,186 | 69.72% | 2,623 | 29.56% | 64 | 0.72% | 3,563 | 40.16% | 8,873 |
| Franklin | 226,265 | 59.96% | 147,585 | 39.11% | 3,507 | 0.93% | 78,680 | 20.85% | 377,357 |
| Fulton | 10,230 | 66.31% | 5,076 | 32.90% | 122 | 0.79% | 5,154 | 33.41% | 15,428 |
| Gallia | 7,399 | 59.92% | 4,834 | 39.14% | 116 | 0.94% | 2,565 | 20.77% | 12,349 |
| Geauga | 22,339 | 64.55% | 11,874 | 34.31% | 395 | 1.14% | 10,465 | 30.24% | 34,608 |
| Greene | 34,432 | 65.14% | 18,025 | 34.10% | 399 | 0.75% | 16,407 | 31.04% | 52,856 |
| Guernsey | 8,507 | 58.42% | 5,926 | 40.69% | 130 | 0.89% | 2,581 | 17.72% | 14,563 |
| Hamilton | 227,004 | 61.29% | 140,354 | 37.89% | 3,026 | 0.82% | 86,650 | 23.39% | 370,384 |
| Hancock | 19,896 | 71.97% | 7,435 | 26.90% | 312 | 1.13% | 12,461 | 45.08% | 27,643 |
| Hardin | 7,291 | 62.82% | 4,145 | 35.71% | 170 | 1.46% | 3,146 | 27.11% | 11,606 |
| Harrison | 3,298 | 45.48% | 3,881 | 53.52% | 73 | 1.01% | -583 | -8.04% | 7,252 |
| Henry | 8,618 | 69.12% | 3,764 | 30.19% | 86 | 0.69% | 4,854 | 38.93% | 12,468 |
| Highland | 8,776 | 66.60% | 4,278 | 32.46% | 124 | 0.94% | 4,498 | 34.13% | 13,178 |
| Hocking | 5,426 | 58.70% | 3,706 | 40.10% | 111 | 1.20% | 1,720 | 18.61% | 9,243 |
| Holmes | 5,064 | 69.22% | 2,179 | 29.78% | 73 | 1.00% | 2,885 | 39.43% | 7,316 |
| Huron | 12,633 | 61.20% | 7,794 | 37.76% | 215 | 1.04% | 4,839 | 23.44% | 20,642 |
| Jackson | 6,671 | 59.21% | 4,505 | 39.98% | 91 | 0.81% | 2,166 | 19.22% | 11,267 |
| Jefferson | 14,141 | 38.73% | 22,095 | 60.52% | 273 | 0.75% | -7,954 | -21.79% | 36,509 |
| Knox | 12,180 | 63.44% | 6,882 | 35.84% | 138 | 0.72% | 5,298 | 27.59% | 19,200 |
| Lake | 52,963 | 56.63% | 39,667 | 42.41% | 894 | 0.96% | 13,296 | 14.22% | 93,524 |
| Lawrence | 12,937 | 52.23% | 11,628 | 46.95% | 203 | 0.82% | 1,309 | 5.29% | 24,768 |
| Licking | 34,540 | 66.72% | 16,793 | 32.44% | 434 | 0.84% | 17,747 | 34.28% | 51,767 |
| Logan | 11,099 | 70.71% | 4,484 | 28.57% | 114 | 0.73% | 6,615 | 42.14% | 15,697 |
| Lorain | 50,410 | 47.14% | 55,600 | 52.00% | 916 | 0.86% | -5,190 | -4.85% | 106,926 |
| Lucas | 83,788 | 45.27% | 99,755 | 53.89% | 1,552 | 0.84% | -15,967 | -8.63% | 185,095 |
| Madison | 8,303 | 70.26% | 3,421 | 28.95% | 93 | 0.79% | 4,882 | 41.31% | 11,817 |
| Mahoning | 43,722 | 36.40% | 75,524 | 62.87% | 880 | 0.73% | -31,802 | -26.47% | 120,126 |
| Marion | 14,864 | 60.13% | 9,596 | 38.82% | 258 | 1.04% | 5,268 | 21.31% | 24,718 |
| Medina | 29,962 | 60.08% | 19,505 | 39.11% | 407 | 0.82% | 10,457 | 20.97% | 49,874 |
| Meigs | 5,486 | 59.14% | 3,699 | 39.88% | 91 | 0.98% | 1,787 | 19.26% | 9,276 |
| Mercer | 11,162 | 68.54% | 4,978 | 30.57% | 146 | 0.90% | 6,184 | 37.97% | 16,286 |
| Miami | 24,915 | 68.38% | 11,138 | 30.57% | 381 | 1.05% | 13,777 | 37.81% | 36,434 |
| Monroe | 2,557 | 37.20% | 4,269 | 62.10% | 48 | 0.70% | -1,712 | -24.91% | 6,874 |
| Montgomery | 131,596 | 57.48% | 95,737 | 41.82% | 1,610 | 0.70% | 35,859 | 15.66% | 228,943 |
| Morgan | 3,713 | 63.37% | 2,085 | 35.59% | 61 | 1.04% | 1,628 | 27.79% | 5,859 |
| Morrow | 7,130 | 66.26% | 3,515 | 32.67% | 115 | 1.07% | 3,615 | 33.60% | 10,760 |
| Muskingum | 19,736 | 62.31% | 11,691 | 36.91% | 247 | 0.78% | 8,045 | 25.40% | 31,674 |
| Noble | 3,155 | 59.44% | 2,079 | 39.17% | 74 | 1.39% | 1,076 | 20.27% | 5,308 |
| Ottawa | 9,352 | 53.39% | 8,038 | 45.89% | 127 | 0.73% | 1,314 | 7.50% | 17,517 |
| Paulding | 5,381 | 62.78% | 3,114 | 36.33% | 76 | 0.89% | 2,267 | 26.45% | 8,571 |
| Perry | 6,602 | 56.28% | 5,011 | 42.72% | 118 | 1.01% | 1,591 | 13.56% | 11,731 |
| Pickaway | 10,796 | 68.36% | 4,905 | 31.06% | 93 | 0.59% | 5,891 | 37.30% | 15,794 |
| Pike | 5,611 | 51.39% | 5,191 | 47.54% | 117 | 1.07% | 420 | 3.85% | 10,919 |
| Portage | 26,334 | 50.18% | 25,607 | 48.79% | 539 | 1.03% | 727 | 1.39% | 52,480 |
| Preble | 10,297 | 66.95% | 4,937 | 32.10% | 147 | 0.96% | 5,360 | 34.85% | 15,381 |
| Putnam | 11,183 | 73.09% | 4,004 | 26.17% | 114 | 0.75% | 7,179 | 46.92% | 15,301 |
| Richland | 30,047 | 60.04% | 19,617 | 39.20% | 383 | 0.77% | 10,430 | 20.84% | 50,047 |
| Ross | 14,563 | 60.39% | 9,271 | 38.45% | 279 | 1.16% | 5,292 | 21.95% | 24,113 |
| Sandusky | 14,203 | 58.61% | 9,709 | 40.07% | 320 | 1.32% | 4,494 | 18.55% | 24,232 |
| Scioto | 16,029 | 52.11% | 14,442 | 46.95% | 289 | 0.94% | 1,587 | 5.16% | 30,760 |
| Seneca | 13,704 | 58.49% | 9,504 | 40.56% | 222 | 0.95% | 4,200 | 17.93% | 23,430 |
| Shelby | 12,198 | 70.00% | 5,065 | 29.07% | 162 | 0.93% | 7,133 | 40.94% | 17,425 |
| Stark | 87,087 | 55.08% | 69,639 | 44.05% | 1,370 | 0.87% | 17,448 | 11.04% | 158,096 |
| Summit | 101,155 | 46.92% | 112,612 | 52.23% | 1,822 | 0.85% | -11,457 | -5.31% | 215,589 |
| Trumbull | 38,815 | 39.51% | 58,674 | 59.72% | 761 | 0.77% | -19,859 | -20.21% | 98,250 |
| Tuscarawas | 17,145 | 54.28% | 14,185 | 44.90% | 259 | 0.82% | 2,960 | 9.37% | 31,589 |
| Union | 8,846 | 73.28% | 3,130 | 25.93% | 95 | 0.79% | 5,716 | 47.35% | 12,071 |
| Van Wert | 9,410 | 70.56% | 3,848 | 28.85% | 78 | 0.58% | 5,562 | 41.71% | 13,336 |
| Vinton | 2,652 | 52.19% | 2,385 | 46.94% | 44 | 0.87% | 267 | 5.25% | 5,081 |
| Warren | 31,419 | 73.38% | 11,145 | 26.03% | 254 | 0.59% | 20,274 | 47.35% | 42,818 |
| Washington | 14,767 | 59.27% | 9,967 | 40.00% | 182 | 0.73% | 4,800 | 19.26% | 24,916 |
| Wayne | 22,320 | 61.64% | 13,571 | 37.48% | 317 | 0.88% | 8,749 | 24.16% | 36,208 |
| Williams | 10,782 | 69.18% | 4,666 | 29.94% | 137 | 0.88% | 6,116 | 39.24% | 15,585 |
| Wood | 26,013 | 57.89% | 18,579 | 41.35% | 341 | 0.76% | 7,434 | 16.54% | 44,933 |
| Wyandot | 6,178 | 66.87% | 2,936 | 31.78% | 125 | 1.35% | 3,242 | 35.09% | 9,239 |
| Totals | 2,416,549 | 55.00% | 1,939,629 | 44.15% | 37,521 | 0.85% | 476,920 | 10.85% | 4,393,699 |
References
- "1988 Presidential General Election Results – Ohio". Dave Leip's Atlas of U.S. Presidential Elections. Retrieved February 7, 2018.
- Sullivan, Robert David; ‘How the Red and Blue Map Evolved Over the Past Century’; America Magazine in The National Catholic Review; June 29, 2016
- "Since 1980s, the Kindest of Tax Cuts for the Rich". The New York Times. January 18, 2012. Retrieved July 21, 2013.