1988 United States presidential election in Pennsylvania
The 1988 United States presidential election in Pennsylvania took place on November 8, 1988, and was part of the 1988 United States presidential election. Voters chose 25 representatives, or electors to the Electoral College, who voted for president and vice president.
| ||||||||||||||||||||||||||
| ||||||||||||||||||||||||||
 County Results
| ||||||||||||||||||||||||||
| ||||||||||||||||||||||||||
| Elections in Pennsylvania |
|---|
 |
|
|
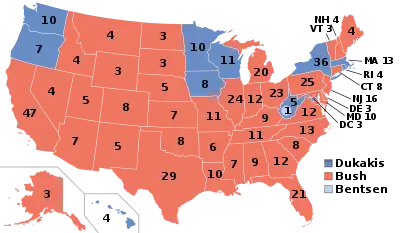
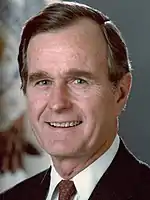
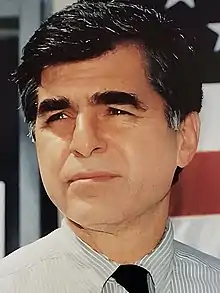
Pennsylvania voted for the Republican nominee, Vice President George H. W. Bush, over the Democratic nominee, Massachusetts governor Michael Dukakis. Bush won the state by a narrow margin of 2.31%, which made Pennsylvania about 5.5% more Democratic than the nation at large. This was the last election where Pennsylvania would be carried by a Republican presidential candidate until 2016 and the last election done so by a Republican with a majority of the vote. Northampton and Luzerne counties, both statewide bellwethers, would also not vote Republican again until 2016.[1] This was also the first election since 1932 where Pennsylvania did not vote the same as neighboring New York, another phenomenon that would not occur again until 2016.
As of the 2020 presidential election, this is the last election in which three Philadelphia-area suburban counties--Bucks, Montgomery, and Delaware—as well as Lehigh County have voted Republican at the presidential level.[1] This is also the last time a Republican won a majority in Northampton County and Monroe County. Bush became the first ever (and, to date, only) Republican to win the White House without carrying Indiana County, as well as the first to do so without carrying Clinton County since Benjamin Harrison in 1888.
Primaries
Republican primary
| Candidate | Votes | Percent |
|---|---|---|
| George H. W. Bush | 687,323 | 78.95% |
| Bob Dole | 103,763 | 11.92% |
| Pat Robertson | 79,463 | 9.13% |
| Totals | 870,549 | Turnout: 38.18% |
Democratic primary
| Candidate | Votes | Percent |
|---|---|---|
| Michael Dukakis | 1,002,480 | 66.49% |
| Jesse Jackson | 411,260 | 27.28% |
| Al Gore | 44,542 | 2.95% |
| Others | 49,408 | 3.28% |
| Totals | 1,507,690 | Turnout: 52.93% |
Results
| 1988 United States presidential election in Pennsylvania[2] | |||||
|---|---|---|---|---|---|
| Party | Candidate | Votes | Percentage | Electoral votes | |
| Republican | George H. W. Bush | 2,300,087 | 50.70% | 25 | |
| Democratic | Michael Dukakis | 2,194,944 | 48.39% | 0 | |
| Consumer | Eugene McCarthy | 19,158 | 0.42% | 0 | |
| Libertarian | Ron Paul | 12,051 | 0.27% | 0 | |
| New Alliance | Lenora Fulani | 4,379 | 0.10% | 0 | |
| America First | David Duke | 3,444 | 0.08% | 0 | |
| Workers' League | Edward Winn | 2,188 | 0.05% | 0 | |
| Totals | 4,536,251 | 100.00% | 25 | ||
Results by county
| County | George Herbert Walker Bush Republican |
Michael Stanley Dukakis Democratic |
Various candidates Other parties |
Margin | Total votes cast | ||||
|---|---|---|---|---|---|---|---|---|---|
| # | % | # | % | # | % | # | % | ||
| Adams | 15,650 | 64.92% | 8,299 | 34.43% | 156 | 0.65% | 7,351 | 30.50% | 24,105 |
| Allegheny | 231,137 | 39.43% | 348,814 | 59.51% | 6,200 | 1.06% | -117,677 | -20.08% | 586,151 |
| Armstrong | 11,509 | 44.81% | 13,892 | 54.09% | 282 | 1.10% | -2,383 | -9.28% | 25,683 |
| Beaver | 25,764 | 33.69% | 50,327 | 65.81% | 378 | 0.49% | -24,563 | -32.12% | 76,469 |
| Bedford | 11,123 | 65.55% | 5,754 | 33.91% | 92 | 0.54% | 5,369 | 31.64% | 16,969 |
| Berks | 70,153 | 62.39% | 41,040 | 36.50% | 1,251 | 1.11% | 29,113 | 25.89% | 112,444 |
| Blair | 25,623 | 61.50% | 15,588 | 37.42% | 451 | 1.08% | 10,035 | 24.09% | 41,662 |
| Bradford | 13,568 | 66.72% | 6,635 | 32.63% | 134 | 0.66% | 6,933 | 34.09% | 20,337 |
| Bucks | 127,563 | 59.99% | 82,472 | 38.78% | 2,605 | 1.23% | 45,091 | 21.21% | 212,640 |
| Butler | 27,777 | 54.82% | 22,341 | 44.09% | 549 | 1.08% | 5,436 | 10.73% | 50,667 |
| Cambria | 25,626 | 39.70% | 38,517 | 59.67% | 409 | 0.63% | -12,891 | -19.97% | 64,552 |
| Cameron | 1,731 | 65.20% | 901 | 33.94% | 23 | 0.87% | 830 | 31.26% | 2,655 |
| Carbon | 10,232 | 52.35% | 9,104 | 46.57% | 211 | 1.08% | 1,128 | 5.77% | 19,547 |
| Centre | 23,875 | 56.14% | 18,357 | 43.17% | 295 | 0.69% | 5,518 | 12.98% | 42,527 |
| Chester | 93,522 | 67.00% | 44,853 | 32.13% | 1,210 | 0.87% | 48,669 | 34.87% | 139,585 |
| Clarion | 8,026 | 58.37% | 5,616 | 40.84% | 109 | 0.79% | 2,410 | 17.53% | 13,751 |
| Clearfield | 14,296 | 53.52% | 12,235 | 45.80% | 182 | 0.68% | 2,061 | 7.72% | 26,713 |
| Clinton | 5,735 | 49.38% | 5,759 | 49.59% | 119 | 1.02% | -24 | -0.21% | 11,613 |
| Columbia | 12,114 | 60.51% | 7,767 | 38.79% | 140 | 0.70% | 4,347 | 21.71% | 20,021 |
| Crawford | 17,249 | 56.32% | 13,021 | 42.51% | 358 | 1.17% | 4,228 | 13.80% | 30,628 |
| Cumberland | 47,292 | 65.29% | 24,613 | 33.98% | 528 | 0.73% | 22,679 | 31.31% | 72,433 |
| Dauphin | 48,917 | 57.77% | 35,079 | 41.43% | 681 | 0.80% | 13,838 | 16.34% | 84,677 |
| Delaware | 147,656 | 59.95% | 96,144 | 39.03% | 2,505 | 1.02% | 51,512 | 20.91% | 246,305 |
| Elk | 6,737 | 52.86% | 5,879 | 46.13% | 128 | 1.00% | 858 | 6.73% | 12,744 |
| Erie | 48,306 | 46.76% | 53,913 | 52.19% | 1,081 | 1.05% | -5,607 | -5.43% | 103,300 |
| Fayette | 16,915 | 33.60% | 33,098 | 65.74% | 336 | 0.67% | -16,183 | -32.14% | 50,349 |
| Forest | 1,159 | 56.13% | 895 | 43.34% | 11 | 0.53% | 264 | 12.78% | 2,065 |
| Franklin | 27,086 | 68.32% | 12,368 | 31.20% | 190 | 0.48% | 14,718 | 37.13% | 39,644 |
| Fulton | 3,086 | 66.42% | 1,532 | 32.97% | 28 | 0.60% | 1,554 | 33.45% | 4,646 |
| Greene | 4,879 | 34.62% | 9,126 | 64.75% | 90 | 0.64% | -4,247 | -30.13% | 14,095 |
| Huntingdon | 8,800 | 64.56% | 4,752 | 34.86% | 79 | 0.58% | 4,048 | 29.70% | 13,631 |
| Indiana | 14,983 | 47.21% | 16,514 | 52.03% | 242 | 0.76% | -1,531 | -4.82% | 31,739 |
| Jefferson | 9,743 | 60.48% | 6,235 | 38.71% | 131 | 0.81% | 3,508 | 21.78% | 16,109 |
| Juniata | 4,881 | 62.87% | 2,834 | 36.50% | 49 | 0.63% | 2,047 | 26.37% | 7,764 |
| Lackawanna | 42,083 | 47.42% | 45,591 | 51.38% | 1,067 | 1.20% | -3,508 | -3.95% | 88,741 |
| Lancaster | 96,979 | 70.77% | 38,982 | 28.45% | 1,068 | 0.78% | 57,997 | 42.32% | 137,029 |
| Lawrence | 15,829 | 41.76% | 21,884 | 57.74% | 191 | 0.50% | -6,055 | -15.97% | 37,904 |
| Lebanon | 24,415 | 66.69% | 11,912 | 32.54% | 281 | 0.77% | 12,503 | 34.15% | 36,608 |
| Lehigh | 56,363 | 56.30% | 42,801 | 42.76% | 943 | 0.94% | 13,562 | 13.55% | 100,107 |
| Luzerne | 59,059 | 50.01% | 58,553 | 49.58% | 480 | 0.41% | 506 | 0.43% | 118,092 |
| Lycoming | 24,792 | 64.00% | 13,528 | 34.92% | 415 | 1.07% | 11,264 | 29.08% | 38,735 |
| McKean | 9,323 | 63.22% | 5,300 | 35.94% | 124 | 0.84% | 4,023 | 27.28% | 14,747 |
| Mercer | 21,301 | 46.43% | 24,278 | 52.92% | 301 | 0.66% | -2,977 | -6.49% | 45,880 |
| Mifflin | 8,170 | 62.49% | 4,790 | 36.63% | 115 | 0.88% | 3,380 | 25.85% | 13,075 |
| Monroe | 17,185 | 62.79% | 9,859 | 36.02% | 327 | 1.19% | 7,326 | 26.77% | 27,371 |
| Montgomery | 170,294 | 60.20% | 109,834 | 38.83% | 2,742 | 0.97% | 60,460 | 21.37% | 282,870 |
| Montour | 3,617 | 63.50% | 2,031 | 35.66% | 48 | 0.84% | 1,586 | 27.84% | 5,696 |
| Northampton | 42,748 | 51.52% | 39,264 | 47.32% | 966 | 1.16% | 3,484 | 4.20% | 82,978 |
| Northumberland | 20,207 | 58.07% | 14,255 | 40.96% | 338 | 0.97% | 5,952 | 17.10% | 34,800 |
| Perry | 8,545 | 68.18% | 3,910 | 31.20% | 78 | 0.62% | 4,635 | 36.98% | 12,533 |
| Philadelphia | 219,053 | 32.45% | 449,566 | 66.60% | 6,358 | 0.94% | -230,513 | -34.15% | 674,977 |
| Pike | 6,659 | 67.15% | 3,097 | 31.23% | 161 | 1.62% | 3,562 | 35.92% | 9,917 |
| Potter | 4,432 | 67.23% | 2,119 | 32.15% | 41 | 0.62% | 2,313 | 35.09% | 6,592 |
| Schuylkill | 32,666 | 56.47% | 24,797 | 42.87% | 379 | 0.66% | 7,869 | 13.60% | 57,842 |
| Snyder | 9,054 | 76.87% | 2,658 | 22.57% | 67 | 0.57% | 6,396 | 54.30% | 11,779 |
| Somerset | 16,809 | 54.63% | 13,815 | 44.90% | 144 | 0.47% | 2,994 | 9.73% | 30,768 |
| Sullivan | 1,808 | 61.88% | 1,091 | 37.34% | 23 | 0.79% | 717 | 24.54% | 2,922 |
| Susquehanna | 9,077 | 64.58% | 4,871 | 34.65% | 108 | 0.77% | 4,206 | 29.92% | 14,056 |
| Tioga | 9,471 | 66.00% | 4,807 | 33.50% | 72 | 0.50% | 4,664 | 32.50% | 14,350 |
| Union | 7,912 | 71.05% | 3,163 | 28.40% | 61 | 0.55% | 4,749 | 42.65% | 11,136 |
| Venango | 11,468 | 56.60% | 8,624 | 42.56% | 171 | 0.84% | 2,844 | 14.04% | 20,263 |
| Warren | 8,991 | 56.21% | 6,790 | 42.45% | 214 | 1.34% | 2,201 | 13.76% | 15,995 |
| Washington | 28,651 | 37.43% | 47,527 | 62.08% | 375 | 0.49% | -18,876 | -24.66% | 76,553 |
| Wayne | 9,926 | 71.61% | 3,775 | 27.23% | 161 | 1.16% | 6,151 | 44.37% | 13,862 |
| Westmoreland | 61,472 | 44.13% | 76,710 | 55.07% | 1,108 | 0.80% | -15,238 | -10.94% | 139,290 |
| Wyoming | 6,607 | 69.94% | 2,797 | 29.61% | 43 | 0.46% | 3,810 | 40.33% | 9,447 |
| York | 72,408 | 65.16% | 37,691 | 33.92% | 1,017 | 0.92% | 34,717 | 31.24% | 111,116 |
| Totals | 2,300,087 | 50.70% | 2,194,944 | 48.39% | 41,220 | 0.91% | 105,143 | 2.32% | 4,536,251 |
References
- Sullivan, Robert David; ‘How the Red and Blue Map Evolved Over the Past Century’; America Magazine in The National Catholic Review; June 29, 2016
- David Leip. "1988 Presidential General Election Results – Pennsylvania". Dave Leip’s U.S. Election Atlas. Retrieved March 23, 2018.