2004 United States presidential election in Minnesota
The 2004 United States presidential election in Minnesota took place on November 2, 2004 as part of the 2004 United States presidential election. Voters chose ten representatives, or electors to the Electoral College, who voted for president and vice president.
| ||||||||||||||||||||||||||
| Turnout | 78.77%[1] | |||||||||||||||||||||||||
|---|---|---|---|---|---|---|---|---|---|---|---|---|---|---|---|---|---|---|---|---|---|---|---|---|---|---|
| ||||||||||||||||||||||||||
| ||||||||||||||||||||||||||
| ||||||||||||||||||||||||||
| Elections in Minnesota |
|---|
 |
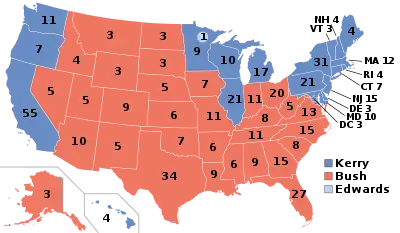
Minnesota was won by Democratic nominee John Kerry by a 3.5% margin of victory. Prior to the election, most news organizations considered it as a major swing state in 2004 based on pre-election polling. The state is historically a blue state, as the last Republican to carry the state in a presidential election was Richard Nixon in 1972. However, in 2000 Al Gore carried the state with just 48% of the vote, by a margin of just 2.5%. In 2004, Minnesota was the only state to split its electoral votes, as a faithless elector pledged to Kerry cast a ballot for John Edwards (written as John Ewards), his running mate.
Caucuses
Campaign
Predictions
There were 12 news organizations who made state-by-state predictions of the election. Here are their last predictions before election day.[2]
| Source | Ranking |
|---|---|
| D.C. Political Report | Lean D |
| Cook Political Report | Tossup |
| Research 2000 | Lean D |
| Zogby International | Likely D |
| Washington Post | Tossup |
| Washington Dispatch | Likely D |
| Washington Times | Tossup |
| The New York Times | Tossup |
| CNN | Likely D |
| Newsweek | Tossup |
| Associated Press | Lean D |
| Rasmussen Reports | Tossup |
Polling
Minnesota was considered a swing state based on its tight poll numbers. In early 2004, Kerry was leading in every poll against Bush, sometimes even reaching 50%. However, in the summer, Kerry was still leading in most of the polls but the gap was very small. It wasn't until late October when Bush was leading him. In the last poll by Rasmussen Reports, Kerry won with 48% to 47%, but left a lot of undecided voters. In the last 3 polling average, Kerry lead 49% to 47%, but with Bush winning 2 of 3.[3] The last poll average by Real Clear Politics showed Kerry leading 49% to 45%.[4] Overall polls showed a lot of undecided voters. On election day, Kerry won with 51% of the vote.
Analysis

Minnesota is the state with the longest streak as a blue state, having last backed the Republican presidential nominee in Richard Nixon's 1972 landslide, and even sticking with the Democrats during Ronald Reagan's two landslides in 1980 and 1984. However, in 2000 and 2004 it was considered a battleground state. Both campaigns invested resources in it, and it ultimately stayed in the Democratic column both times but by relatively narrow margins.
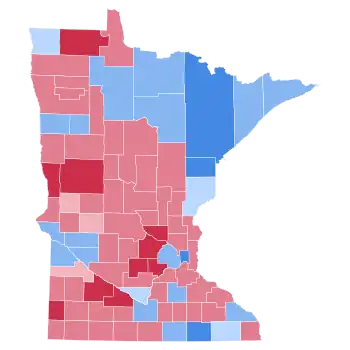
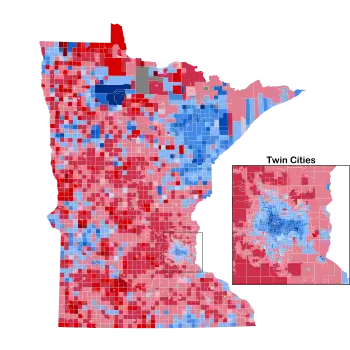
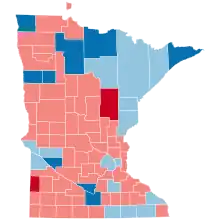
In 2004, the county results were fairly uniform across the state; only a handful of counties had either Bush or Kerry getting over 60% of the vote, and no county had either candidate with over 70% of the vote. Despite winning the state, Kerry won just three of eight congressional districts: Minnesota's 4th congressional district, Minnesota's 5th congressional district, and Minnesota's 8th congressional district.
As of the 2020 presidential election, this is the last election in which Washington County, Olmsted County, and Dakota County voted for the Republican candidate. This was the first time since 1928 that a Republican had won a majority in Anoka County. Bush became the first ever Republican to win the White House without carrying Nicollet County.
Results
| 2004 United States presidential election in Minnesota | |||||
|---|---|---|---|---|---|
| Party | Candidate | Votes | Percentage | Electoral votes | |
| Democratic (DFL) | John Kerry | 1,445,014 | 51.09% | 9 | |
| Republican Party | George W. Bush (Inc.) | 1,346,695 | 47.61% | 0 | |
| Independent | Ralph Nader | 18,683 | 0.66% | 0 | |
| Libertarian Party | Michael Badnarik | 4,639 | 0.16% | 0 | |
| Green Party | David Cobb | 4,408 | 0.16% | 0 | |
| Constitution Party | Michael Peroutka | 3,074 | 0.11% | 0 | |
| Independent | Write Ins | 2,530 | 0.09% | 0 | |
| Christian Freedom Party | Thomas Harens | 2,387 | 0.08% | 0 | |
| Socialist Equality Party | Bill Van Auken | 539 | 0.02% | 0 | |
| Socialist Workers Party | Roger Calero | 416 | 0.01% | 0 | |
| Socialist Party USA (Write-in) | Walt Brown (Write-in) | 2 | 0.00% | 0 | |
| Democratic (DFL) | John Edwards | 0 | 0.00% | 1 | |
| Totals | 2,828,387 | 100.00% | 10 | ||
| Voter Turnout (Voting Age Population) | 74.2% | ||||
By county
| County | John Kerry Democratic |
George W. Bush Republican |
Various candidates Other parties |
Margin | Total votes cast | ||||
|---|---|---|---|---|---|---|---|---|---|
| # | % | # | % | # | % | # | % | ||
| Aitkin | 4,539 | 48.02% | 4,768 | 50.44% | 145 | 1.53% | -229 | -2.42% | 9,452 |
| Anoka | 80,226 | 46.09% | 91,853 | 52.77% | 1,987 | 1.14% | -11,627 | -6.68% | 174,066 |
| Becker | 6,756 | 40.21% | 9,795 | 58.30% | 250 | 1.49% | -3,039 | -18.09% | 16,801 |
| Beltrami | 10,592 | 50.13% | 10,237 | 48.45% | 302 | 1.43% | 355 | 1.68% | 21,131 |
| Benton | 8,059 | 43.84% | 10,043 | 54.63% | 282 | 1.43% | -1,984 | -10.79% | 18,384 |
| Big Stone | 1,536 | 50.08% | 1,483 | 48.35% | 48 | 1.57% | 53 | 1.73% | 3,067 |
| Blue Earth | 16,865 | 50.92% | 15,737 | 47.52% | 517 | 1.56% | 1,128 | 3.40% | 33,119 |
| Brown | 5,158 | 37.44% | 8,395 | 60.93% | 225 | 1.63% | -3,237 | -23.49% | 13,778 |
| Carlton | 11,462 | 62.52% | 6,642 | 36.23% | 230 | 1.25% | 4,820 | 26.29% | 18,334 |
| Carver | 16,456 | 36.24% | 28,510 | 62.78% | 445 | 0.98% | -12,054 | -26.54% | 45,411 |
| Cass | 6,835 | 42.96% | 8,875 | 55.78% | 200 | 1.26% | -2,040 | -12.82% | 15,910 |
| Chippewa | 3,424 | 51.83% | 3,089 | 46.76% | 93 | 1.41% | 335 | 5.07% | 6,606 |
| Chisago | 12,219 | 43.24% | 15,705 | 55.57% | 336 | 1.19% | -3,486 | -12.33% | 28,260 |
| Clay | 12,989 | 46.83% | 14,365 | 51.79% | 383 | 1.38% | -1,376 | -4.96% | 27,737 |
| Clearwater | 1,871 | 42.90% | 2,438 | 55.90% | 52 | 1.19% | -567 | -13.00% | 4,361 |
| Cook | 1,733 | 52.47% | 1,489 | 45.08% | 81 | 2.45% | 244 | 7.39% | 3,303 |
| Cottonwood | 2,726 | 42.80% | 3,557 | 55.85% | 86 | 1.36% | -831 | -13.05% | 6,369 |
| Crow Wing | 14,005 | 41.75% | 19,106 | 56.96% | 434 | 1.29% | -5,101 | -15.21% | 33,545 |
| Dakota | 104,635 | 48.48% | 108,959 | 50.48% | 2,252 | 1.04% | -4,324 | -2.00% | 215,846 |
| Dodge | 4,117 | 41.72% | 5,593 | 56.68% | 158 | 1.60% | -1,476 | -14.96% | 9,868 |
| Douglas | 8,219 | 40.47% | 11,793 | 58.07% | 297 | 1.46% | -3,574 | -17.60% | 20,309 |
| Faribault | 3,767 | 43.39% | 4,794 | 55.22% | 120 | 1.38% | -1,027 | -11.83% | 8,681 |
| Fillmore | 5,825 | 49.79% | 5,694 | 48.67% | 179 | 1.53% | 131 | 1.12% | 11,698 |
| Freeborn | 9,733 | 55.09% | 7,681 | 43.48% | 252 | 1.43% | 2,052 | 11.61% | 17,666 |
| Goodhue | 12,103 | 47.26% | 13,134 | 51.29% | 371 | 1.45% | -1,031 | -4.03% | 25,608 |
| Grant | 1,856 | 48.60% | 1,893 | 49.57% | 70 | 1.83% | -37 | -0.97% | 3,819 |
| Hennepin | 383,841 | 59.33% | 255,133 | 39.43% | 8,007 | 1.24% | 128,708 | 19.90% | 646,981 |
| Houston | 5,276 | 47.61% | 5,631 | 50.81% | 175 | 1.58% | -355 | -3.20% | 11,082 |
| Hubbard | 4,741 | 41.81% | 6,444 | 56.83% | 155 | 1.37% | -1,703 | -15.02% | 11,340 |
| Isanti | 7,883 | 40.82% | 11,190 | 57.94% | 240 | 1.24% | -3,307 | -17.12% | 19,313 |
| Itasca | 13,290 | 54.54% | 10,705 | 43.93% | 372 | 1.52% | 2,585 | 10.61% | 24,367 |
| Jackson | 2,652 | 45.89% | 3,024 | 52.33% | 103 | 1.78% | -372 | -6.44% | 5,779 |
| Kanabec | 3,592 | 43.55% | 4,527 | 54.89% | 129 | 1.56% | -935 | -11.34% | 8,248 |
| Kandiyohi | 9,337 | 43.74% | 11,704 | 54.82% | 308 | 1.45% | -2,367 | -11.08% | 21,349 |
| Kittson | 1,333 | 49.70% | 1,307 | 48.73% | 42 | 1.57% | 26 | 0.97% | 2,682 |
| Koochiching | 3,662 | 50.10% | 3,539 | 48.42% | 108 | 1.48% | 123 | 1.68% | 7,309 |
| Lac Qui Parle | 2,390 | 52.63% | 2,093 | 46.09% | 58 | 1.27% | 297 | 6.54% | 4,541 |
| Lake | 4,212 | 59.57% | 2,769 | 39.16% | 90 | 1.27% | 1,433 | 20.41% | 7,071 |
| Lake of the Woods | 921 | 38.38% | 1,428 | 59.50% | 51 | 2.13% | -507 | -21.12% | 2,400 |
| Le Sueur | 6,466 | 44.83% | 7,746 | 53.70% | 212 | 1.46% | -1,280 | -8.87% | 14,424 |
| Lincoln | 1,558 | 46.62% | 1,736 | 51.94% | 48 | 1.44% | -178 | -5.32% | 3,342 |
| Lyon | 5,292 | 41.76% | 7,203 | 56.84% | 178 | 1.40% | -1,911 | -15.08% | 12,673 |
| McLeod | 6,712 | 36.45% | 11,407 | 61.95% | 293 | 1.60% | -4,695 | -25.50% | 18,412 |
| Mahnomen | 1,339 | 53.39% | 1,132 | 45.14% | 37 | 1.48% | 207 | 8.25% | 2,508 |
| Marshall | 2,308 | 41.50% | 3,187 | 57.30% | 67 | 1.21% | -879 | -15.80% | 5,562 |
| Martin | 4,590 | 41.55% | 6,311 | 57.13% | 146 | 1.33% | -1,721 | -15.58% | 11,047 |
| Meeker | 5,292 | 42.91% | 6,854 | 55.57% | 188 | 1.52% | -1,562 | -12.66% | 12,334 |
| Mille Lacs | 5,677 | 43.45% | 7,194 | 55.06% | 194 | 1.48% | -1,517 | -11.61% | 13,065 |
| Morrison | 6,794 | 40.54% | 9,698 | 57.87% | 266 | 1.59% | -2,904 | -17.33% | 16,758 |
| Mower | 12,334 | 60.99% | 7,591 | 37.54% | 297 | 1.47% | 4,743 | 23.45% | 20,222 |
| Murray | 2,218 | 44.38% | 2,719 | 54.40% | 61 | 1.22% | -501 | -10.02% | 4,998 |
| Nicollet | 8,797 | 49.59% | 8,689 | 48.98% | 255 | 1.43% | 108 | 0.61% | 17,741 |
| Nobles | 3,898 | 42.35% | 5,159 | 56.05% | 147 | 1.60% | -1,261 | -13.70% | 9,204 |
| Norman | 1,954 | 51.29% | 1,794 | 47.09% | 62 | 1.62% | 160 | 4.20% | 3,810 |
| Olmsted | 33,285 | 46.50% | 37,371 | 52.21% | 919 | 1.29% | -4,086 | -5.71% | 71,575 |
| Otter Tail | 12,038 | 37.41% | 19,734 | 61.33% | 406 | 1.26% | -7,696 | -23.92% | 32,178 |
| Pennington | 3,117 | 44.42% | 3,767 | 53.68% | 133 | 1.89% | -650 | -9.26% | 7,017 |
| Pine | 7,228 | 49.79% | 7,033 | 48.44% | 257 | 1.78% | 195 | 1.35% | 14,518 |
| Pipestone | 1,900 | 37.76% | 3,066 | 60.93% | 66 | 1.31% | -1,166 | -23.17% | 5,032 |
| Polk | 6,729 | 42.95% | 8,724 | 55.68% | 215 | 1.37% | -1,995 | -12.73% | 15,668 |
| Pope | 3,301 | 49.27% | 3,303 | 49.30% | 96 | 1.43% | -2 | -0.03% | 6,700 |
| Ramsey | 171,846 | 63.04% | 97,096 | 35.62% | 3,635 | 1.34% | 74,750 | 27.42% | 272,577 |
| Red Lake | 963 | 44.24% | 1,164 | 53.47% | 50 | 2.29% | -201 | -9.23% | 2,177 |
| Redwood | 3,104 | 38.14% | 4,898 | 60.18% | 137 | 1.68% | -1,794 | -22.04% | 8,139 |
| Renville | 3,787 | 45.36% | 4,430 | 53.06% | 132 | 1.58% | -643 | -7.70% | 8,349 |
| Rice | 16,425 | 53.42% | 13,881 | 45.15% | 439 | 1.43% | 2,544 | 8.27% | 30,745 |
| Rock | 2,000 | 38.53% | 3,111 | 59.93% | 80 | 1.54% | -1,111 | -21.40% | 5,191 |
| Roseau | 2,442 | 30.87% | 5,355 | 67.69% | 114 | 1.44% | -2,913 | -36.82% | 7,911 |
| St. Louis | 77,958 | 65.20% | 40,112 | 33.55% | 1,495 | 1.25% | 37,846 | 31.65% | 119,565 |
| Scott | 23,958 | 39.51% | 36,055 | 59.46% | 626 | 1.03% | -12,097 | -19.95% | 60,639 |
| Sherburne | 15,816 | 38.15% | 25,182 | 60.75% | 456 | 1.10% | -9,366 | -22.60% | 41,454 |
| Sibley | 3,109 | 39.11% | 4,669 | 58.74% | 171 | 2.15% | -1,560 | -19.63% | 7,949 |
| Stearns | 32,659 | 43.21% | 41,726 | 55.21% | 1,192 | 1.58% | -9,067 | -12.00% | 75,577 |
| Steele | 7,994 | 42.76% | 10,389 | 55.57% | 312 | 1.67% | -2,395 | -12.81% | 18,695 |
| Stevens | 2,821 | 47.42% | 3,030 | 50.93% | 98 | 1.64% | -209 | -3.51% | 5,949 |
| Swift | 3,165 | 55.19% | 2,481 | 43.26% | 89 | 1.55% | 684 | 11.93% | 5,735 |
| Todd | 5,034 | 41.21% | 6,945 | 56.86% | 235 | 1.92% | -1,911 | -15.65% | 12,214 |
| Traverse | 1,026 | 47.92% | 1,076 | 50.26% | 39 | 1.82% | -50 | -2.34% | 2,141 |
| Wabasha | 5,548 | 46.88% | 6,120 | 51.71% | 167 | 1.41% | -572 | -4.83% | 11,835 |
| Wadena | 2,791 | 39.35% | 4,214 | 59.41% | 88 | 1.24% | -1,423 | -20.06% | 7,093 |
| Waseca | 4,179 | 42.64% | 5,457 | 55.68% | 164 | 1.67% | -1,278 | -13.04% | 9,800 |
| Washington | 61,395 | 47.80% | 65,751 | 51.19% | 1,303 | 1.01% | -4,356 | -3.39% | 128,449 |
| Watonwan | 2,514 | 45.03% | 2,970 | 53.20% | 99 | 1.77% | -456 | -8.17% | 5,583 |
| Wilkin | 1,169 | 33.14% | 2,303 | 65.30% | 55 | 1.56% | -1,134 | -32.16% | 3,527 |
| Winona | 14,231 | 51.90% | 12,686 | 46.26% | 505 | 1.84% | 1,545 | 5.64% | 27,422 |
| Wright | 22,618 | 37.99% | 36,176 | 60.77% | 740 | 1.24% | -13,558 | -22.78% | 59,534 |
| Yellow Medicine | 2,799 | 48.61% | 2,878 | 49.98% | 81 | 1.40% | -79 | -1.37% | 5,758 |
| Totals | 1,445,014 | 51.09% | 1,346,695 | 47.61% | 36,678 | 1.40% | 98,319 | 3.48% | 2,828,387 |
|
Democratic
Hold
Gain from Republican |
Republican
Hold
Gain from Democratic
|
Counties that flipped from Democratic to Republican
Counties that flipped from Republican to Democratic
- Beltrami (largest municipality: Bemidji)
- Blue Earth (largest municipality: Mankato)
- Chippewa (largest municipality: Montevideo)
- Cook (largest municipality: Grand Marais)
- Kittson (Largest city: Hallock)
- Koochiching (Largest city: International Falls)
- Mahnomen (largest municipality: Mahnomen)
- Nicollet (largest municipality: North Mankato)
- Norman (largest municipality: Ada)
By congressional district
Bush won 5 of 8 congressional districts, including one held by a Democrat.[9]
| District | Bush | Kerry | Representative |
|---|---|---|---|
| 1st | 51% | 47% | Gil Gutknecht |
| 2nd | 54% | 45% | John Kline |
| 3rd | 51% | 48% | Jim Ramstad |
| 4th | 37% | 62% | Betty McCollum |
| 5th | 28% | 71% | Martin Olav Sabo |
| 6th | 57% | 42% | Mark Kennedy |
| 7th | 55% | 43% | Collin Peterson |
| 8th | 46% | 53% | Jim Oberstar |
Electors
Technically the voters of Minnesota cast their ballots for electors: representatives to the Electoral College. Minnesota is allocated 10 electors because it has 8 congressional districts and 2 senators. All candidates who appear on the ballot or qualify to receive write-in votes must submit a list of 10 electors, who pledge to vote for their candidate and his or her running mate. Whoever wins the majority of votes in the state is awarded all 10 electoral votes. Their chosen electors then vote for president and vice president. Although electors are pledged to their candidate and running mate, they are not obligated to vote for them. An elector who votes for someone other than his or her candidate is known as a faithless elector.
The electors of each state and the District of Columbia met on December 13, 2004, to cast their votes for president and vice president. The Electoral College itself never meets as one body. Instead the electors from each state and the District of Columbia met in their respective capitols.
The following were the members of the Electoral College from the state. Nine were pledged for Kerry/Edwards, but one made a mistake and ended up voting for Ewards/Edwards[10] and thus became a faithless elector. Minnesota's electors cast secret ballots, so unless one of the electors claims responsibility, it is unlikely that the identity of the faithless elector will ever be known. As a result of this incident, Minnesota Statutes were amended to provide for public balloting of the electors' votes and invalidation of a vote cast for someone other than the candidate to whom the elector is pledged.[11]
- Sonja Berg
- Vi Grooms-Alban
- Matthew Little
- Michael Meuers
- Tim O'Brien
- Lil Ortendahl
- Everett Pettiford
- Jean Schiebel
- Frank Simon
- Chandler Harrison Stevens
Notes
- Although John Kerry won Minnesota's 10 electoral votes, 1 faithless elector voted for John Edwards (written as John Ewards) instead of Kerry
References
- "Office of the State Of Minnesota Secretary of State". www.sos.state.mn.us. Retrieved July 22, 2017.
- "Archived copy". dcpoliticalreport.com. Archived from the original on November 21, 2010. Retrieved January 15, 2022.
{{cite web}}: CS1 maint: archived copy as title (link) - "2004 Presidential Election Polls. Minnesota Polls". US Election Atles.
- "RealClear Politics - Polls". Archived from the original on July 6, 2004.
- "George W Bush - $374,659,453 raised, '04 election cycle, Republican Party, President".
- "John F Kerry - $345,826,176 raised, '04 election cycle, Democrat Party, President".
- "CNN.com Specials". CNN.
- "CNN.com Specials". CNN.
- "Presidential Results by Congressional District, 2000-2008 – Swing State Project".
- "MPR: Minnesota elector gives Edwards a vote; Kerry gets other nine".
- "208.08, 2008 Minnesota Statutes". Revisor.leg.state.mn.us. Retrieved May 5, 2009.

