1936 United States presidential election in Minnesota
The 1936 United States presidential election in Minnesota took place on November 3, 1936, as part of the 1936 United States presidential election. Voters chose 11 electors, or representatives to the Electoral College, who voted for president and vice president.
| |||||||||||||||||||||||||||||||||
| |||||||||||||||||||||||||||||||||
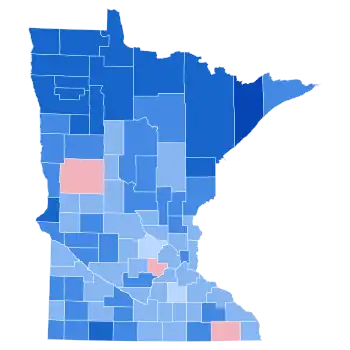
 County Results
| |||||||||||||||||||||||||||||||||
| |||||||||||||||||||||||||||||||||
| Elections in Minnesota |
|---|
 |
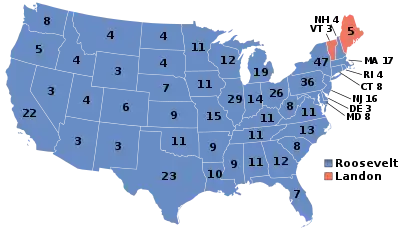
Minnesota was won by the Democratic candidate, incumbent President Franklin D. Roosevelt won the state over Kansas governor Alf Landon by a margin of 348,350 votes, or 30.83%—nearly doubling Landon's overall share of the state's vote. Nationally, Roosevelt was soundly re-elected, with 523 electoral votes and a landslide 24.26% lead over Landon in the popular vote. Landon carried only two states: Maine and Vermont, whilst in Minnesota Landon won just three counties: Otter Tail in the rural west, Carver in the exurban Twin Cities, and southeastern Fillmore County. Of these, only Fillmore has ever voted Democratic in a presidential election since,[1] doing so initially in Lyndon Johnson’s 1964 landslide, and in every election from 1992 to 2012.
Only five presidential nominees have ever won a greater percentage of the vote in Minnesota than Roosevelt did in 1936: Theodore Roosevelt in 1904 (74%), Warren G. Harding in 1920 (70.6%), Lyndon B. Johnson in 1964 (63.8%), Abraham Lincoln in 1860 (63.5%), and James A. Garfield in 1880 (62.3%)—every one of them going on to win the election nationally. As of the 2020 election, this is the last election in which either major party candidate exceeded 80% of the vote in any Minnesota county, with Roosevelt doing so in Lake County (which coincidentally was the only county in Minnesota that Roosevelt didn't win in the previous presidential election).
Roosevelt’s 30.8% margin of victory over Landon remains the widest margin by which any Democrat has ever carried Minnesota in a presidential election. This was the first time Democrats carried the state in consecutive elections.
Results
| 1936 United States presidential election in Minnesota[2] | |||||
|---|---|---|---|---|---|
| Party | Candidate | Votes | Percentage | Electoral votes | |
| Democratic | Franklin D. Roosevelt (incumbent) | 698,811 | 61.84% | 11 | |
| Republican | Alf Landon | 350,461 | 31.01% | 0 | |
| Union | William Lemke | 74,296 | 6.58% | 0 | |
| Socialist | Norman Thomas | 2,872 | 0.25% | 0 | |
| Communist | Earl Browder | 2,574 | 0.23% | 0 | |
| Socialist Labor | John W. Aiken | 961 | 0.09% | 0 | |
| Totals | 1,129,975 | 100.00% | 11 | ||
Results by county
| County | Franklin Delano Roosevelt Democratic |
Alfred Mossman Landon Republican |
William Frederick Lemke[3] Union |
Various candidates Other parties |
Margin | Total votes cast[4] | |||||
|---|---|---|---|---|---|---|---|---|---|---|---|
| # | % | # | % | # | % | # | % | # | % | ||
| Aitkin | 3,806 | 57.57% | 2,466 | 37.30% | 229 | 3.46% | 110 | 1.66% | 1,340 | 20.27% | 6,611 |
| Anoka | 4,501 | 56.91% | 2,586 | 32.70% | 788 | 9.96% | 34 | 0.43% | 1,915 | 24.21% | 7,909 |
| Becker | 6,473 | 68.38% | 2,683 | 28.34% | 249 | 2.63% | 61 | 0.64% | 3,790 | 40.04% | 9,466 |
| Beltrami | 6,507 | 72.65% | 2,182 | 24.36% | 157 | 1.75% | 111 | 1.24% | 4,325 | 48.29% | 8,957 |
| Benton | 3,111 | 53.52% | 1,783 | 30.67% | 905 | 15.57% | 14 | 0.24% | 1,328 | 22.85% | 5,813 |
| Big Stone | 2,648 | 66.22% | 1,116 | 27.91% | 221 | 5.53% | 14 | 0.35% | 1,532 | 38.31% | 3,999 |
| Blue Earth | 8,255 | 55.89% | 5,550 | 37.58% | 921 | 6.24% | 43 | 0.29% | 2,705 | 18.32% | 14,769 |
| Brown | 6,637 | 64.64% | 2,679 | 26.09% | 899 | 8.76% | 52 | 0.51% | 3,958 | 38.55% | 10,267 |
| Carlton | 7,136 | 75.29% | 2,163 | 22.82% | 81 | 0.85% | 98 | 1.03% | 4,973 | 52.47% | 9,478 |
| Carver | 2,814 | 38.59% | 3,095 | 42.44% | 1,366 | 18.73% | 17 | 0.23% | -281 | -3.85% | 7,292 |
| Cass | 4,440 | 60.54% | 2,634 | 35.91% | 229 | 3.12% | 31 | 0.42% | 1,806 | 24.63% | 7,334 |
| Chippewa | 4,027 | 61.40% | 2,223 | 33.89% | 268 | 4.09% | 41 | 0.63% | 1,804 | 27.50% | 6,559 |
| Chisago | 3,360 | 55.26% | 2,462 | 40.49% | 229 | 3.77% | 29 | 0.48% | 898 | 14.77% | 6,080 |
| Clay | 6,282 | 65.29% | 2,880 | 29.93% | 416 | 4.32% | 43 | 0.45% | 3,402 | 35.36% | 9,621 |
| Clearwater | 3,208 | 75.34% | 939 | 22.05% | 92 | 2.16% | 19 | 0.45% | 2,269 | 53.29% | 4,258 |
| Cook | 793 | 65.86% | 387 | 32.14% | 18 | 1.50% | 6 | 0.50% | 406 | 33.72% | 1,204 |
| Cottonwood | 3,929 | 59.32% | 2,509 | 37.88% | 171 | 2.58% | 14 | 0.21% | 1,420 | 21.44% | 6,623 |
| Crow Wing | 6,561 | 61.47% | 3,611 | 33.83% | 431 | 4.04% | 70 | 0.66% | 2,950 | 27.64% | 10,673 |
| Dakota | 8,890 | 57.73% | 4,043 | 26.26% | 2,407 | 15.63% | 58 | 0.38% | 4,847 | 31.48% | 15,398 |
| Dodge | 2,812 | 54.73% | 2,138 | 41.61% | 176 | 3.43% | 12 | 0.23% | 674 | 13.12% | 5,138 |
| Douglas | 4,186 | 56.84% | 2,681 | 36.41% | 474 | 6.44% | 23 | 0.31% | 1,505 | 20.44% | 7,364 |
| Faribault | 5,603 | 56.90% | 3,773 | 38.32% | 451 | 4.58% | 20 | 0.20% | 1,830 | 18.58% | 9,847 |
| Fillmore | 4,764 | 45.79% | 5,054 | 48.58% | 559 | 5.37% | 27 | 0.26% | -290 | -2.79% | 10,404 |
| Freeborn | 7,378 | 59.96% | 4,653 | 37.81% | 245 | 1.99% | 29 | 0.24% | 2,725 | 22.15% | 12,305 |
| Goodhue | 8,257 | 57.50% | 5,682 | 39.57% | 364 | 2.53% | 58 | 0.40% | 2,575 | 17.93% | 14,361 |
| Grant | 2,358 | 57.87% | 1,566 | 38.43% | 121 | 2.97% | 30 | 0.74% | 792 | 19.44% | 4,075 |
| Hennepin | 144,289 | 58.78% | 81,206 | 33.08% | 18,468 | 7.52% | 1,517 | 0.62% | 63,083 | 25.70% | 245,480 |
| Houston | 3,156 | 51.74% | 2,701 | 44.28% | 221 | 3.62% | 22 | 0.36% | 455 | 7.46% | 6,100 |
| Hubbard | 2,312 | 56.92% | 1,618 | 39.83% | 106 | 2.61% | 26 | 0.64% | 694 | 17.09% | 4,062 |
| Isanti | 3,442 | 67.19% | 1,437 | 28.05% | 201 | 3.92% | 43 | 0.84% | 2,005 | 39.14% | 5,123 |
| Itasca | 8,896 | 69.41% | 3,592 | 28.03% | 190 | 1.48% | 139 | 1.08% | 5,304 | 41.38% | 12,817 |
| Jackson | 5,187 | 72.09% | 1,676 | 23.29% | 311 | 4.32% | 21 | 0.29% | 3,511 | 48.80% | 7,195 |
| Kanabec | 2,579 | 63.09% | 1,350 | 33.02% | 133 | 3.25% | 26 | 0.64% | 1,229 | 30.06% | 4,088 |
| Kandiyohi | 6,595 | 69.25% | 2,500 | 26.25% | 352 | 3.70% | 77 | 0.81% | 4,095 | 43.00% | 9,524 |
| Kittson | 3,127 | 73.25% | 1,080 | 25.30% | 31 | 0.73% | 31 | 0.73% | 2,047 | 47.95% | 4,269 |
| Koochiching | 5,065 | 77.77% | 1,316 | 20.21% | 84 | 1.29% | 48 | 0.74% | 3,749 | 57.56% | 6,513 |
| Lac qui Parle | 3,243 | 54.09% | 2,066 | 34.46% | 679 | 11.32% | 8 | 0.13% | 1,177 | 19.63% | 5,996 |
| Lake | 2,717 | 80.15% | 617 | 18.20% | 30 | 0.88% | 26 | 0.77% | 2,100 | 61.95% | 3,390 |
| Lake of the Woods | 1,566 | 76.32% | 385 | 18.76% | 73 | 3.56% | 28 | 1.36% | 1,181 | 57.55% | 2,052 |
| Le Sueur | 5,077 | 57.27% | 2,849 | 32.14% | 920 | 10.38% | 19 | 0.21% | 2,228 | 25.13% | 8,865 |
| Lincoln | 2,662 | 61.42% | 1,199 | 27.66% | 448 | 10.34% | 25 | 0.58% | 1,463 | 33.76% | 4,334 |
| Lyon | 5,163 | 61.29% | 2,551 | 30.28% | 695 | 8.25% | 15 | 0.18% | 2,612 | 31.01% | 8,424 |
| McLeod | 4,449 | 55.21% | 2,941 | 36.50% | 635 | 7.88% | 33 | 0.41% | 1,508 | 18.71% | 8,058 |
| Mahnomen | 2,025 | 76.88% | 474 | 18.00% | 120 | 4.56% | 15 | 0.57% | 1,551 | 58.88% | 2,634 |
| Marshall | 4,802 | 70.08% | 1,904 | 27.79% | 116 | 1.69% | 30 | 0.44% | 2,898 | 42.29% | 6,852 |
| Martin | 6,492 | 66.08% | 3,090 | 31.45% | 215 | 2.19% | 28 | 0.28% | 3,402 | 34.63% | 9,825 |
| Meeker | 4,242 | 56.25% | 2,479 | 32.87% | 797 | 10.57% | 24 | 0.32% | 1,763 | 23.38% | 7,542 |
| Mille Lacs | 3,767 | 60.56% | 2,091 | 33.62% | 333 | 5.35% | 29 | 0.47% | 1,676 | 26.95% | 6,220 |
| Morrison | 6,112 | 62.06% | 2,682 | 27.23% | 1,022 | 10.38% | 32 | 0.32% | 3,430 | 34.83% | 9,848 |
| Mower | 8,228 | 61.01% | 4,743 | 35.17% | 467 | 3.46% | 49 | 0.36% | 3,485 | 25.84% | 13,487 |
| Murray | 3,926 | 67.05% | 1,601 | 27.34% | 316 | 5.40% | 12 | 0.20% | 2,325 | 39.71% | 5,855 |
| Nicollet | 4,136 | 59.06% | 2,360 | 33.70% | 488 | 6.97% | 19 | 0.27% | 1,776 | 25.36% | 7,003 |
| Nobles | 4,919 | 60.94% | 2,601 | 32.22% | 531 | 6.58% | 21 | 0.26% | 2,318 | 28.72% | 8,072 |
| Norman | 3,778 | 68.67% | 1,570 | 28.54% | 89 | 1.62% | 65 | 1.18% | 2,208 | 40.13% | 5,502 |
| Olmsted | 8,958 | 60.04% | 5,316 | 35.63% | 583 | 3.91% | 62 | 0.42% | 3,642 | 24.41% | 14,919 |
| Otter Tail | 8,642 | 47.72% | 8,899 | 49.14% | 438 | 2.42% | 131 | 0.72% | -257 | -1.42% | 18,110 |
| Pennington | 3,736 | 72.47% | 1,258 | 24.40% | 100 | 1.94% | 61 | 1.18% | 2,478 | 48.07% | 5,155 |
| Pine | 5,797 | 67.11% | 2,452 | 28.39% | 309 | 3.58% | 80 | 0.93% | 3,345 | 38.72% | 8,638 |
| Pipestone | 3,026 | 58.53% | 1,881 | 36.38% | 250 | 4.84% | 13 | 0.25% | 1,145 | 22.15% | 5,170 |
| Polk | 11,337 | 73.44% | 3,751 | 24.30% | 245 | 1.59% | 104 | 0.67% | 7,586 | 49.14% | 15,437 |
| Pope | 3,200 | 61.05% | 1,869 | 35.65% | 159 | 3.03% | 14 | 0.27% | 1,331 | 25.39% | 5,242 |
| Ramsey | 86,286 | 66.00% | 30,553 | 23.37% | 13,200 | 10.10% | 689 | 0.53% | 55,733 | 42.63% | 130,728 |
| Red Lake | 2,057 | 77.53% | 487 | 18.36% | 89 | 3.35% | 20 | 0.75% | 1,570 | 59.18% | 2,653 |
| Redwood | 4,965 | 55.34% | 3,286 | 36.63% | 691 | 7.70% | 30 | 0.33% | 1,679 | 18.71% | 8,972 |
| Renville | 5,344 | 56.53% | 3,049 | 32.25% | 1,021 | 10.80% | 39 | 0.41% | 2,295 | 24.28% | 9,453 |
| Rice | 5,928 | 48.09% | 4,888 | 39.65% | 1,473 | 11.95% | 38 | 0.31% | 1,040 | 8.44% | 12,327 |
| Rock | 2,910 | 60.15% | 1,752 | 36.21% | 163 | 3.37% | 13 | 0.27% | 1,158 | 23.94% | 4,838 |
| Roseau | 3,761 | 71.42% | 1,326 | 25.18% | 124 | 2.35% | 55 | 1.04% | 2,435 | 46.24% | 5,266 |
| Saint Louis | 69,365 | 74.18% | 22,332 | 23.88% | 709 | 0.76% | 1,104 | 1.18% | 47,033 | 50.30% | 93,510 |
| Scott | 3,861 | 58.87% | 1,528 | 23.30% | 1,153 | 17.58% | 17 | 0.26% | 2,333 | 35.57% | 6,559 |
| Sherburne | 1,881 | 50.33% | 1,623 | 43.43% | 223 | 5.97% | 10 | 0.27% | 258 | 6.90% | 3,737 |
| Sibley | 4,140 | 61.47% | 2,184 | 32.43% | 388 | 5.76% | 23 | 0.34% | 1,956 | 29.04% | 6,735 |
| Stearns | 12,760 | 56.51% | 5,262 | 23.30% | 4,485 | 19.86% | 73 | 0.32% | 7,498 | 33.21% | 22,580 |
| Steele | 4,481 | 54.49% | 3,373 | 41.01% | 362 | 4.40% | 8 | 0.10% | 1,108 | 13.47% | 8,224 |
| Stevens | 2,352 | 59.42% | 1,431 | 36.15% | 167 | 4.22% | 8 | 0.20% | 921 | 23.27% | 3,958 |
| Swift | 3,749 | 62.63% | 1,618 | 27.03% | 610 | 10.19% | 9 | 0.15% | 2,131 | 35.60% | 5,986 |
| Todd | 5,627 | 56.26% | 3,780 | 37.79% | 575 | 5.75% | 20 | 0.20% | 1,847 | 18.47% | 10,002 |
| Traverse | 2,297 | 73.06% | 761 | 24.20% | 82 | 2.61% | 4 | 0.13% | 1,536 | 48.85% | 3,144 |
| Wabasha | 4,122 | 53.55% | 2,663 | 34.60% | 893 | 11.60% | 19 | 0.25% | 1,459 | 18.96% | 7,697 |
| Wadena | 2,605 | 56.03% | 1,898 | 40.83% | 117 | 2.52% | 29 | 0.62% | 707 | 15.21% | 4,649 |
| Waseca | 3,520 | 55.45% | 2,482 | 39.10% | 330 | 5.20% | 16 | 0.25% | 1,038 | 16.35% | 6,348 |
| Washington | 6,768 | 57.80% | 3,863 | 32.99% | 1,030 | 8.80% | 49 | 0.42% | 2,905 | 24.81% | 11,710 |
| Watonwan | 3,668 | 63.55% | 1,930 | 33.44% | 160 | 2.77% | 14 | 0.24% | 1,738 | 30.11% | 5,772 |
| Wilkin | 2,428 | 61.66% | 1,278 | 32.45% | 220 | 5.59% | 12 | 0.30% | 1,150 | 29.20% | 3,938 |
| Winona | 9,268 | 59.60% | 5,353 | 34.42% | 850 | 5.47% | 80 | 0.51% | 3,915 | 25.18% | 15,551 |
| Wright | 5,363 | 47.25% | 4,087 | 36.01% | 1,842 | 16.23% | 59 | 0.52% | 1,276 | 11.24% | 11,351 |
| Yellow Medicine | 3,921 | 58.71% | 2,029 | 30.38% | 717 | 10.74% | 12 | 0.18% | 1,892 | 28.33% | 6,679 |
| Totals | 698,811 | 61.84% | 350,459 | 31.01% | 74,296 | 6.58% | 6,407 | 0.57% | 348,352 | 30.83% | 1,129,973 |
References
- Sullivan, Robert David; ‘How the Red and Blue Map Evolved Over the Past Century’; America Magazine in The National Catholic Review; June 29, 2016
- "1936 Presidential Election Results, 1936". Dave Leip's U.S. Election Atlas. Retrieved October 5, 2016.
- Géoelections; 1936 Presidential Election Popular Vote (.xlsx file for €15 on request)
- Scammon, Richard M. (compiler); America at the Polls: A Handbook of Presidential Election Statistics 1920-1964; pp. 234-235 ISBN 0405077114
.jpg.webp)
.jpg.webp)
.jpg.webp)
