2010 Wirral Metropolitan Borough Council election
The 2010 Wirral Metropolitan Borough Council election took place on 6 May 2010 to elect members of Wirral Metropolitan Borough Council in England.[1] This election was held on the same day as other local elections.
| |||||||||||||||||||||||||||||||||||||||||||||||||
23 of 66 seats (One Third and one by-election) to Wirral Metropolitan Borough Council 34 seats needed for a majority | |||||||||||||||||||||||||||||||||||||||||||||||||
|---|---|---|---|---|---|---|---|---|---|---|---|---|---|---|---|---|---|---|---|---|---|---|---|---|---|---|---|---|---|---|---|---|---|---|---|---|---|---|---|---|---|---|---|---|---|---|---|---|---|
| Turnout | 65.3% ( | ||||||||||||||||||||||||||||||||||||||||||||||||
| |||||||||||||||||||||||||||||||||||||||||||||||||
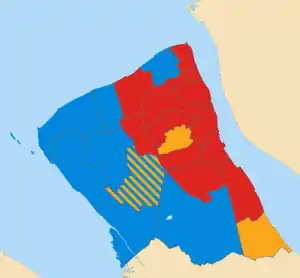 Map of results of 2010 election | |||||||||||||||||||||||||||||||||||||||||||||||||
| |||||||||||||||||||||||||||||||||||||||||||||||||

The council stayed under no overall control, with the Conservatives becoming the largest single party, and resulted in a new Lib-Con coalition.
After the election, the composition of the council was:
| Party | Seats | ± | |
|---|---|---|---|
| Conservative | 27 | ||
| Labour | 24 | ||
| Liberal Democrat | 15 | ||
| Ind. Conservative | 0 | ||
Election results
Overall election result
Overall result compared with 2008.
| Wirral Metropolitan Borough Council election result, 2010 | |||||||||||||||
|---|---|---|---|---|---|---|---|---|---|---|---|---|---|---|---|
| Party | Candidates | Votes | |||||||||||||
| Stood | Elected | Gained | Unseated | Net | % of total | % | No. | Net % | |||||||
| Labour | 23 | 12 | 4 | 0 | 54.5 | 37.6 | 58,715 | ||||||||
| Conservative | 23 | 8 | 4 | 2 | 34.1 | 32.1 | 50,206 | ||||||||
| Liberal Democrats | 23 | 3 | 0 | 5 | 11.4 | 22.5 | 35,168 | ||||||||
| Green | 21 | 0 | 0 | 0 | 0.0 | 3.6 | 5,623 | ||||||||
| UKIP | 19 | 0 | 0 | 0 | 0.0 | 3.4 | 5,307 | ||||||||
| BNP | 5 | 0 | 0 | 0 | 0.0 | 0.9 | 1,339 | ||||||||
| Ind. Conservative | 0 | 0 | 0 | 0 | 0.0 | 0.0 | 0 | N/A | |||||||
Changes in council composition
Prior to the election the composition of the council was:
| 25 | 20 | 19 | 1 | 1 |
| Con | Lab | Lib Dem | IC | V |
After the election the composition of the council was:
| 27 | 24 | 15 |
| Con | Lab | Lib Dem |
Ward results
Results compared directly with the last local election in 2008.
Bebington
| Party | Candidate | Votes | % | ±% | |
|---|---|---|---|---|---|
| Labour | Walter Smith | 3,822 | 45.9 | ||
| Conservative | Kevin Sharkey | 2,482 | 29.8 | ||
| Liberal Democrats | Catherine Jennings | 1,315 | 15.8 | ||
| UKIP | Hilary Jones | 520 | 6.2 | ||
| Green | Michael Harper | 186 | 2.2 | ||
| Majority | 1,340 | 16.1 | N/A | ||
| Registered electors | 11,793 | ||||
| Turnout | 71.4 | ||||
| Labour hold | Swing | ||||
Bidston and St James
| Party | Candidate | Votes | % | ±% | |
|---|---|---|---|---|---|
| Labour | Ann McLachlan | 2,932 | 63.1 | ||
| Liberal Democrats | John Brace | 699 | 15.0 | ||
| Conservative | John Gilbert | 502 | 10.8 | ||
| BNP | John Edwards | 251 | 5.4 | ||
| UKIP | Audrey Fitpatrick | 154 | 3.3 | New | |
| Green | George Bowler | 111 | 2.4 | ||
| Majority | 2,233 | 48.1 | |||
| Registered electors | 9,768 | ||||
| Turnout | 48.1 | ||||
| Labour hold | Swing | ||||
Birkenhead and Tranmere
| Party | Candidate | Votes | % | ±% | |
|---|---|---|---|---|---|
| Labour | Brian Kenny | 2,409 | 51.8 | ||
| Green | Pat Cleary | 1,095 | 23.6 | ||
| Liberal Democrats | Peter Heppinstall | 566 | 12.2 | ||
| Conservative | June Cowin | 380 | 8.2 | ||
| UKIP | David Martin | 198 | 4.3 | New | |
| Majority | 1,314 | 28.2 | |||
| Registered electors | 9,956 | ||||
| Turnout | 47.3 | ||||
| Labour hold | Swing | ||||
Bromborough
| Party | Candidate | Votes | % | ±% | |
|---|---|---|---|---|---|
| Labour | Irene Williams | 3,016 | 44.6 | ||
| Liberal Democrats | Madeline Booth | 1,815 | 26.9 | ||
| Conservative | Sue Colquhoun | 1,428 | 21.1 | ||
| BNP | David Bell | 328 | 4.9 | ||
| Green | Percy Hogg | 132 | 2.5 | ||
| Majority | 1,201 | 17.7 | N/A | ||
| Registered electors | 10,758 | ||||
| Turnout | 63.7 | ||||
| Labour gain from Liberal Democrats | Swing | ||||
Clatterbridge
| Party | Candidate | Votes | % | ±% | |
|---|---|---|---|---|---|
| Conservative | Peter Kearney | 3,733 | 43.4 | ||
| Liberal Democrats | Simon Thomson | 2,313 | 26.9 | ||
| Labour | Audrey Moore | 2,015 | 23.4 | ||
| UKIP | Roger Jones | 361 | 4.2 | ||
| Green | Jim McGinley | 187 | 2.2 | ||
| Majority | 1,420 | 16.5 | |||
| Registered electors | 11,706 | ||||
| Turnout | 74.7 | ||||
| Conservative gain from Liberal Democrats | Swing | ||||
Claughton
| Party | Candidate | Votes | % | ±% | |
|---|---|---|---|---|---|
| Labour | Denise Roberts | 3,521 | 51.5 | ||
| Conservative | Barbara Sinclair | 1,574 | 23.0 | ||
| Liberal Democrats | Margaret Teggin | 1,182 | 17.3 | ||
| UKIP | Bethan Williams | 319 | 4.7 | New | |
| Green | Cathy Page | 240 | 3.5 | ||
| Majority | 1,947 | 28.5 | |||
| Registered electors | 11,340 | ||||
| Turnout | 61.0 | ||||
| Labour hold | Swing | ||||
Eastham
| Party | Candidate | Votes | % | ±% | |
|---|---|---|---|---|---|
| Liberal Democrats | Tom Harney | 3,824 | 50.0 | ||
| Labour | Willow Colios | 1,942 | 25.4 | ||
| Conservative | Nick Whieldon | 1,644 | 21.5 | ||
| UKIP | Laurence Jones | 241 | 3.1 | New | |
| Majority | 1,882 | 24.6 | |||
| Registered electors | 11,095 | ||||
| Turnout | 69.2 | ||||
| Liberal Democrats hold | Swing | ||||
Greasby, Frankby and Irby
| Party | Candidate | Votes | % | ±% | |
|---|---|---|---|---|---|
| Conservative | Wendy Clements | 3,538 | 40.3 | ||
| Liberal Democrats | Alaine Christian | 2,949 | 33.5 | ||
| Labour | Geoffrey Dormand | 1,800 | 20.5 | ||
| UKIP | Derek Snowden | 287 | 3.3 | New | |
| Green | Michael Gardner | 216 | 2.5 | ||
| Majority | 589 | 6.8 | N/A | ||
| Registered electors | 11,611 | ||||
| Turnout | 76.0 | ||||
| Conservative gain from Liberal Democrats | Swing | ||||
Heswall
| Party | Candidate | Votes | % | ±% | |
|---|---|---|---|---|---|
| Conservative | Les Rowlands | 5,000 | 59.1 | ||
| Liberal Democrats | Alexander Clark | 1,534 | 18.1 | ||
| Labour | Yvonne Nolan | 1,465 | 17.3 | ||
| Green | Matthew Rosseinsky | 251 | 3.0 | ||
| UKIP | Oliver Sayle-Adam | 213 | 2.5 | ||
| Majority | 3,466 | 41.0 | |||
| Registered electors | 10,992 | ||||
| Turnout | 77.4 | ||||
| Conservative hold | Swing | ||||
Hoylake and Meols
| Party | Candidate | Votes | % | ±% | |
|---|---|---|---|---|---|
| Conservative | Eddie Boult | 3,748 | 49.3 | ||
| Labour | Paul Doughty | 1,848 | 24.3 | ||
| Liberal Democrats | Mark Corran | 1,417 | 18.6 | ||
| Green | Yvonne McGinley | 397 | 5.2 | ||
| UKIP | Frank Whitham | 197 | 2.6 | New | |
| Majority | 1,900 | 25.0 | |||
| Registered electors | 10,457 | ||||
| Turnout | 73.3 | ||||
| Conservative gain from Ind. Conservative | Swing | ||||
Leasowe and Moreton East
| Party | Candidate | Votes | % | ±% | |
|---|---|---|---|---|---|
| Labour | Ann McArdle | 3,404 | 51.9 | ||
| Conservative | Steve Smith | 1,948 | 29.7 | ||
| Liberal Democrats | Gerald Hainsworth | 866 | 13.2 | ||
| UKIP | Russell Jones | 216 | 3.3 | New | |
| Green | Shirley Johnson | 129 | 2.0 | ||
| Majority | 1,456 | 22.2 | N/A | ||
| Registered electors | 10,905 | ||||
| Turnout | 60.7 | ||||
| Labour hold | Swing | ||||
Liscard
| Party | Candidate | Votes | % | ±% | |
|---|---|---|---|---|---|
| Labour | Darren Dodd | 3,220 | 46.8 | ||
| Conservative | Leah Fraser | 2,474 | 36.0 | ||
| Liberal Democrats | Daniel Clein | 718 | 10.4 | ||
| UKIP | Lynda Williams | 238 | 3.5 | ||
| Green | John Bleasdale | 231 | 3.4 | ||
| Majority | 746 | 10.8 | N/A | ||
| Registered electors | 11,071 | ||||
| Turnout | 63.1 | ||||
| Labour gain from Conservative | Swing | ||||
Moreton West and Saughall Massie
| Party | Candidate | Votes | % | ±% | |
|---|---|---|---|---|---|
| Conservative | Simon Mountney | 2,976 | 41.5 | ||
| Labour | Deirdre Wood | 2,635 | 36.7 | ||
| Liberal Democrats | Eric Copestake | 992 | 13.8 | ||
| UKIP | Susan Whitham | 236 | 3.3 | ||
| BNP | Brian Winson | 223 | 3.1 | New | |
| Green | Perle Sheldricks | 113 | 1.6 | ||
| Majority | 341 | 4.8 | |||
| Registered electors | 10,824 | ||||
| Turnout | 66.7 | ||||
| Conservative hold | Swing | ||||
New Brighton
| Party | Candidate | Votes | % | ±% | |
|---|---|---|---|---|---|
| Labour | Patricia Glasman | 3,072 | 44.0 | ||
| Conservative | Bill Duffey | 2,173 | 31.2 | ||
| Liberal Democrats | Julia Codling | 1,166 | 16.7 | ||
| Green | Cynthia Stonall | 342 | 4.9 | ||
| UKIP | Timothy Pass | 222 | 3.2 | New | |
| Majority | 899 | 12.8 | N/A | ||
| Registered electors | 11,025 | ||||
| Turnout | 63.6 | ||||
| Labour gain from Conservative | Swing | ||||
Oxton
| Party | Candidate | Votes | % | ±% | |
|---|---|---|---|---|---|
| Liberal Democrats | Alan Brighouse | 2,941 | 40.5 | ||
| Labour | David Barden | 2,310 | 31.8 | ||
| Conservative | Tina McDonnell | 1,425 | 19.6 | ||
| UKIP | Catherine Williams | 301 | 4.2 | ||
| Green | Garnette Bowler | 276 | 3.8 | ||
| Majority | 631 | 8.7 | |||
| Registered electors | 11,237 | ||||
| Turnout | 65.1 | ||||
| Liberal Democrats hold | Swing | ||||
Pensby and Thingwall
| Party | Candidate | Votes | % | ±% | |
|---|---|---|---|---|---|
| Liberal Democrats | Mark Johnston [n 2] | 2,854 | 35.8 | ||
| Conservative | Don McCubbin [n 3] | 2,479 | 31.1 | ||
| Liberal Democrats | Michael Redfern | 2,297 | – | – | |
| Conservative | Adam Sykes | 2,103 | – | – | |
| Labour | Michael Sullivan | 1,673 | 21.0 | ||
| Labour | Sylvia Hodrien | 1,517 | – | – | |
| UKIP | Janet Davison | 518 | 6.5 | ||
| Green | Allen Burton | 448 | 5.6 | ||
| Majority | 375 | 4.7 | |||
| Registered electors | 10,666 | ||||
| Turnout | 71.5 | ||||
| Liberal Democrats hold | Swing | ||||
| Conservative gain from Liberal Democrats | Swing | – | |||
Prenton
| Party | Candidate | Votes | % | ±% | |
|---|---|---|---|---|---|
| Labour | Denise Realey | 2,827 | 39.6 | ||
| Liberal Democrats | Frank Doyle | 2,258 | 31.6 | ||
| Conservative | Robert Hughes | 1,316 | 18.4 | ||
| UKIP | Bruce Cain | 369 | 5.2 | New | |
| BNP | 219 | 3.1 | New | ||
| Green | Mark Mitchell | 150 | 2.1 | ||
| Majority | 569 | 8.0 | N/A | ||
| Registered electors | 11,039 | ||||
| Turnout | 64.9 | ||||
| Labour gain from Liberal Democrats | Swing | ||||
Rock Ferry
| Party | Candidate | Votes | % | ±% | |
|---|---|---|---|---|---|
| Labour | Moira McLaughlin | 2,915 | 59.7 | ||
| Liberal Democrats | Lynne Short | 791 | 16.2 | ||
| Conservative | Rachel Suffield | 694 | 14.2 | ||
| BNP | Janice Brady | 318 | 6.5 | New | |
| Green | Joyce Hogg | 162 | 3.3 | ||
| Majority | 2,124 | 43.5 | |||
| Registered electors | 9,829 | ||||
| Turnout | 50.6 | ||||
| Labour hold | Swing | ||||
Seacombe
| Party | Candidate | Votes | % | ±% | |
|---|---|---|---|---|---|
| Labour | Adrian Jones | 3,349 | 62.8 | ||
| Conservative | Tony Cox | 916 | 17.2 | ||
| Liberal Democrats | Steve Pitt | 725 | 13.6 | ||
| UKIP | Christopher Wellstead | 238 | 4.5 | ||
| Green | Jacqueline Smith | 109 | 2.0 | ||
| Majority | 2,433 | 45.6 | |||
| Registered electors | 10,357 | ||||
| Turnout | 52.4 | ||||
| Labour hold | Swing | ||||
Upton
| Party | Candidate | Votes | % | ±% | |
|---|---|---|---|---|---|
| Labour | Stuart Whittingham | 3,827 | 50.2 | ||
| Conservative | Geoff Gubb | 2,143 | 28.1 | ||
| Liberal Democrats | Alan Davies | 1,370 | 18.0 | ||
| Green | Lesley Hussenbux | 286 | 3.8 | ||
| Majority | 1,684 | 22.1 | N/A | ||
| Registered electors | 12,214 | ||||
| Turnout | 62.9 | ||||
| Labour hold | Swing | ||||
Wallasey
| Party | Candidate | Votes | % | ±% | |
|---|---|---|---|---|---|
| Conservative | Lesley Rennie | 3,623 | 42.8 | ||
| Labour | Christine Jones | 3,082 | 36.4 | ||
| Liberal Democrats | John Codling | 1,269 | 15.0 | ||
| UKIP | Ian Watson | 255 | 3.0 | ||
| Green | James Brady | 234 | 2.8 | ||
| Majority | 541 | 6.4 | |||
| Registered electors | 12,061 | ||||
| Turnout | 70.9 | ||||
| Conservative hold | Swing | ||||
West Kirby and Thurstaston
| Party | Candidate | Votes | % | ±% | |
|---|---|---|---|---|---|
| Conservative | Jeff Green | 4,010 | 51.7 | ||
| Labour | Lee Rushworth | 1,631 | 21.0 | ||
| Liberal Democrats | John Cresswell | 1,604 | 20.7 | ||
| Green | Hara Willow | 290 | 3.7 | ||
| UKIP | Philip Griffiths | 224 | 2.9 | ||
| Majority | 2,379 | 30.7 | |||
| Registered electors | 10,348 | ||||
| Turnout | 75.4 | ||||
| Conservative hold | Swing | ||||
Notes
• italics denote the sitting councillor • bold denotes the winning candidate
- % of total refers to % of wards won.
- Elected to serve a 4-year term.
- Elected to serve a 1-year term.
References
- "Election Result for 6 May 2010 Summary". Wirral Metropolitan Borough Council.
- "Election Result for Bebington ward on 6 May 2010". Wirral Metropolitan Borough Council.
- "Councillor Walter Smith". Wirral Metropolitan Borough Council. Archived from the original on 12 June 2018. Retrieved 12 July 2018.
- "Election Result for Bidston and St. James ward on 6 May 2010". Wirral Metropolitan Borough Council.
- "Councillor Ann McLachlan". Wirral Metropolitan Borough Council. Archived from the original on 12 June 2018. Retrieved 12 July 2018.
- "Election Result for Birkenhead and Tranmere ward on 6 May 2010". Wirral Metropolitan Borough Council.
- "Councillor Brian Kenny". Wirral Metropolitan Borough Council.
- "Councillor Pat Cleary". Wirral Metropolitan Borough Council. 31 July 2023.
- "Election Result for Bromborough ward on 6 May 2010". Wirral Metropolitan Borough Council.
- "Councillor Irene Williams". Wirral Metropolitan Borough Council.
- "Election Result for Clatterbridge ward on 6 May 2010". Wirral Metropolitan Borough Council.
- "Councillor Peter Kearney". Wirral Metropolitan Borough Council.
- "Election Result for Claughton ward on 6 May 2010". Wirral Metropolitan Borough Council.
- "Councillor Denise Roberts". Wirral Metropolitan Borough Council. Archived from the original on 12 June 2018. Retrieved 12 July 2018.
- "Election Result for Eastham ward on 6 May 2010". Wirral Metropolitan Borough Council.
- "Councillor Tom Harney". Wirral Metropolitan Borough Council. Archived from the original on 12 June 2018. Retrieved 12 July 2018.
- "Election Result for Greasby, Frankby and Irby ward on 6 May 2010". Wirral Metropolitan Borough Council.
- "Councillor Wendy Clements". Wirral Metropolitan Borough Council.
- "Election Result for Heswall ward on 6 May 2010". Wirral Metropolitan Borough Council.
- "Councillor Les Rowlands". Wirral Metropolitan Borough Council. Archived from the original on 12 June 2018. Retrieved 12 July 2018.
- "Election Result for Hoylake and Meols ward on 6 May 2010". Wirral Metropolitan Borough Council.
- "Councillor Eddie Boult". Wirral Metropolitan Borough Council.
- "Councillor Paul Doughty". Wirral Metropolitan Borough Council.
- "Election Result for Leasowe and Moreton East ward on 6 May 2010". Wirral Metropolitan Borough Council.
- "Councillor Anne McArdle". Wirral Metropolitan Borough Council. Archived from the original on 5 July 2018. Retrieved 12 July 2018.
- "Election Result for Liscard ward on 6 May 2010". Wirral Metropolitan Borough Council.
- "Councillor Darren Dodd". Wirral Metropolitan Borough Council.
- "Councillor Leah Fraser". Wirral Metropolitan Borough Council.
- "Election Result for Moreton West and Saughall Massie ward on 6 May 2010". Wirral Metropolitan Borough Council.
- "Councillor Simon R Mountney". Wirral Metropolitan Borough Council. 31 July 2023.
- "Election Result for New Brighton ward on 6 May 2010". Wirral Metropolitan Borough Council.
- "Councillor Patricia Glasman". Wirral Metropolitan Borough Council.
- "Election Result for Oxton ward on 6 May 2010". Wirral Metropolitan Borough Council.
- "Councillor Alan Brighouse". Wirral Metropolitan Borough Council. Archived from the original on 12 June 2018. Retrieved 12 July 2018.
- "Election Result for Pensby and Thingwall ward on 6 May 2010". Wirral Metropolitan Borough Council.
- "Councillor Mark Johnston". Wirral Metropolitan Borough Council.
- "Councillor Don McCubbin". Wirral Metropolitan Borough Council. Archived from the original on 12 July 2018. Retrieved 12 July 2018.
- "Councillor Adam Sykes". Wirral Metropolitan Borough Council.
- "Councillor Michael Sullivan". Wirral Metropolitan Borough Council.
- "Councillor Sylvia Hodrien". Wirral Metropolitan Borough Council.
- "Election Result for Prenton ward on 6 May 2010". Wirral Metropolitan Borough Council.
- "Councillor Denise Realey". Wirral Metropolitan Borough Council. Archived from the original on 12 June 2018. Retrieved 12 July 2018.
- "Election Result for Rock Ferry ward on 6 May 2010". Wirral Metropolitan Borough Council.
- "Councillor Moira McLaughlin". Wirral Metropolitan Borough Council. Archived from the original on 12 June 2018. Retrieved 12 July 2018.
- "Election Result for Seacombe ward on 6 May 2010". Wirral Metropolitan Borough Council.
- "Councillor Adrian Jones". Wirral Metropolitan Borough Council. Archived from the original on 12 June 2018. Retrieved 12 July 2018.
- "Councillor Tony Cox". Wirral Metropolitan Borough Council.
- "Election Result for Upton ward on 6 May 2010". Wirral Metropolitan Borough Council.
- "Councillor Stuart Whittingham". Wirral Metropolitan Borough Council.
- "Election Result for Wallasey ward on 6 May 2010". Wirral Metropolitan Borough Council.
- "Councillor Lesley Rennie". Wirral Metropolitan Borough Council. 31 July 2023.
- "Councillor Chris Jones". Wirral Metropolitan Borough Council.
- "Election Result for West Kirby and Thurstaston ward on 6 May 2010". Wirral Metropolitan Borough Council.
- "Councillor Jeff Green". Wirral Metropolitan Borough Council. 31 July 2023.
This article is issued from Wikipedia. The text is licensed under Creative Commons - Attribution - Sharealike. Additional terms may apply for the media files.