1951 Liverpool City Council election
Elections to Liverpool City Council were held on Thursday 11 May 1951.
| ||
|
| ||
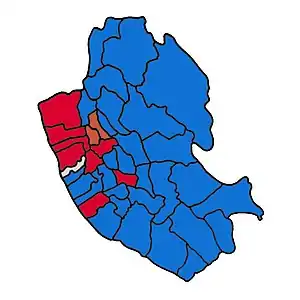 Map of Liverpool showing wards won (first placed party)[1] | ||
After the election, the composition of the council was:
| Party | Councillors | ± | Aldermen | |
|---|---|---|---|---|
| Conservative | ?? | ?? | ?? | |
| Labour | ?? | ?? | ?? | |
| Protestant | ?? | ?? | ?? | |
| Liberal | ?? | ?? | ?? | |
Election result
| Party | Seats | Gains | Losses | Net gain/loss | Seats % | Votes % | Votes | +/− | |
|---|---|---|---|---|---|---|---|---|---|
| Conservative | 28 | 68% | 58% | 120,053 | |||||
| Labour | 10 | 24% | 38% | 79,531 | |||||
| Protestant | 2 | 5% | 2% | 4,230 | |||||
| Independent | 1 | 2.4% | 0.31% | 646 | |||||
| Liberal | 0 | 0 | 0 | 0 | 0% | 0.47% | 964 | ||
| Communist | 0 | 0 | 0 | 0 | 0% | 0.065% | 134 | ||
Ward results
* - Councillor seeking re-election
(PARTY) - Party of former Councillor
The terms of office expired in 1951 for those councillors who were elected in November 1947. Therefore comparisons are made with the 1947 election results.
Abercromby
| Party | Candidate | Votes | % | ±% | |
|---|---|---|---|---|---|
| Conservative | Francis Joseph Bullen * | 2,740 | 53% | -1% | |
| Labour | William Smyth | 2,391 | 47% | +1% | |
| Majority | 349 | ||||
| Registered electors | 13,488 | ||||
| Turnout | 5,131 | 38% | -3% | ||
| Conservative hold | Swing | ||||
Aigburth
| Party | Candidate | Votes | % | ±% | |
|---|---|---|---|---|---|
| Conservative | Herbert Mylrea Allen * | 5,842 | 83% | 0% | |
| Liberal | William Edward Oates | 600 | 9% | ||
| Labour | Roy Stoddart | 565 | 8% | -9% | |
| Majority | 5,267 | ||||
| Registered electors | 15,607 | ||||
| Turnout | 6,997 | 45% | -13% | ||
| Conservative hold | Swing | ||||
Allerton
| Party | Candidate | Votes | % | ±% | |
|---|---|---|---|---|---|
| Conservative | Mrs. Margaret Jane Strong * | 3,068 | 76% | +8% | |
| Labour | William Rice-Jones | 615 | 15% | -8% | |
| Liberal | Mrs. Helena France | 364 | 9% | ||
| Majority | 2,453 | ||||
| Registered electors | 9,583 | ||||
| Turnout | 4,047 | 42% | -15% | ||
| Conservative hold | Swing | ||||
Anfield
| Party | Candidate | Votes | % | ±% | |
|---|---|---|---|---|---|
| Conservative | Albert James White * | 4,698 | 68% | -4% | |
| Labour | Walter Richard Maylor | 2,181 | 32% | -4% | |
| Majority | 2,517 | ||||
| Registered electors | 16,560 | ||||
| Turnout | 6,879 | 42% | 53% | ||
| Conservative hold | Swing | ||||
Breckfield
| Party | Candidate | Votes | % | ±% | |
|---|---|---|---|---|---|
| Conservative | David John Lewis * | 3,100 | 66% | +6% | |
| Labour | Terence Roberts | 1,621 | 34% | -6% | |
| Majority | 1,479 | ||||
| Registered electors | 12,893 | ||||
| Turnout | 4,721 | 37% | -14% | ||
| Conservative hold | Swing | ||||
Brunswick
| Party | Candidate | Votes | % | ±% | |
|---|---|---|---|---|---|
| Labour | Frank Hampton Cain * | 1,982 | 77% | -2% | |
| Conservative | Mrs. Marrion Browne | 582 | 23% | -1% | |
| Majority | 1,400 | ||||
| Registered electors | 7,546 | ||||
| Turnout | 2,564 | 34% | +10% | ||
| Labour hold | Swing | ||||
Castle Street
| Party | Candidate | Votes | % | ±% | |
|---|---|---|---|---|---|
| Conservative | Reginald Poole (PARTY) | 499 | 98% | ||
| Labour | Thomas McNerney | 11 | 2% | ||
| Majority | 488 | ||||
| Registered electors | 922 | ||||
| Turnout | 510 | 55% | |||
| Conservative hold | Swing | ||||
Childwall
| Party | Candidate | Votes | % | ±% | |
|---|---|---|---|---|---|
| Conservative | Alexander Young * | 4,748 | 86% | -4% | |
| Labour | Mrs. Eleanor Elizabeth Wright | 766 | 14% | -4% | |
| Majority | 3,982 | ||||
| Registered electors | 13,476 | ||||
| Turnout | 5,514 | 41% | -14% | ||
| Conservative hold | Swing | ||||
Croxteth
| Party | Candidate | Votes | % | ±% | |
|---|---|---|---|---|---|
| Labour | Sydney Smart * | 6,595 | 51% | 0% | |
| Conservative | Charles McDonald | 6,346 | 49% | -2% | |
| Majority | 249 | ||||
| Registered electors | 34,017 | ||||
| Turnout | 12,941 | 38% | -1% | ||
| Conservative hold | Swing | ||||
Dingle
| Party | Candidate | Votes | % | ±% | |
|---|---|---|---|---|---|
| Conservative | Stanley Airey (PARTY) | 4,470 | 51% | +3% | |
| Labour | Lewis Charles Edwards | 4,344 | 49% | -3% | |
| Majority | 126 | ||||
| Registered electors | 17,840 | ||||
| Turnout | 8,814 | 49% | -1% | ||
| Conservative hold | Swing | ||||
Edge Hill
| Party | Candidate | Votes | % | ±% | |
|---|---|---|---|---|---|
| Labour | John Bagot * | 2,283 | 52% | -2% | |
| Conservative | William Thomas | 2,129 | 48% | +2% | |
| Majority | 154 | ||||
| Registered electors | 13,599 | ||||
| Turnout | 4,412 | 32% | -7% | ||
| Labour hold | Swing | ||||
Everton
| Party | Candidate | Votes | % | ±% | |
|---|---|---|---|---|---|
| Labour | John Braddock * | 2,670 | 58% | 0% | |
| Conservative | Ernest Johnson | 1,970 | 42% | 0% | |
| Majority | 700 | ||||
| Registered electors | 13,213 | ||||
| Turnout | 4,640 | 35% | -4% | ||
| Labour hold | Swing | 0% | |||
Exchange
| Party | Candidate | Votes | % | ±% | |
|---|---|---|---|---|---|
| Independent | Walter McGrath * | 646 | 74% | -5% | |
| Labour | John Cullen | 226 | 26% | +5% | |
| Majority | 420 | ||||
| Registered electors | 1,656 | ||||
| Turnout | 872 | 53% | -2% | ||
| Independent hold | Swing | -5% | |||
Fairfield
| Party | Candidate | Votes | % | ±% | |
|---|---|---|---|---|---|
| Conservative | Robert Nash * | 4,071 | 67% | -1% | |
| Labour | William Indcox Davies | 2,028 | 33% | +1% | |
| Majority | 2,043 | ||||
| Registered electors | 15,494 | ||||
| Turnout | 6,099 | 39% | -12% | ||
| Conservative hold | Swing | -1% | |||
Fazakerley
| Party | Candidate | Votes | % | ±% | |
|---|---|---|---|---|---|
| Conservative | Kenneth Pugh Thompson M.P. * | 5,288 | 54% | 0% | |
| Labour | James Gardner | 4,523 | 46% | 0% | |
| Majority | 765 | ||||
| Registered electors | 19,900 | ||||
| Turnout | 9,811 | 49% | -2% | ||
| Conservative hold | Swing | 0% | |||
Garston
| Party | Candidate | Votes | % | ±% | |
|---|---|---|---|---|---|
| Conservative | Henry Clarke * | 4,958 | 55% | +1% | |
| Labour | William Henry Sefton | 4,038 | 45% | -1% | |
| Majority | 920 | ||||
| Registered electors | 19,796 | ||||
| Turnout | 8,996 | 45% | -12% | ||
| Conservative hold | Swing | +1% | |||
Granby
| Party | Candidate | Votes | % | ±% | |
|---|---|---|---|---|---|
| Conservative | James Edward Thompson * | 2,742 | 55% | 0% | |
| Labour | Mrs. Elizabeth Trainor | 2,225 | 45% | 0% | |
| Majority | 517 | ||||
| Registered electors | 12,869 | ||||
| Turnout | 4,967 | 39% | -4% | ||
| Conservative hold | Swing | ||||
Great George
| Party | Candidate | Votes | % | ±% | |
|---|---|---|---|---|---|
| Conservative | John James Coupland (PARTY) | 920 | 57% | +2% | |
| Labour | Thomas George Dominic Maguire | 686 | 43% | -2% | |
| Majority | 234 | ||||
| Registered electors | 3,360 | ||||
| Turnout | 1,606 | 48% | +1% | ||
| Conservative hold | Swing | ||||
Kensington
| Party | Candidate | Votes | % | ±% | |
|---|---|---|---|---|---|
| Conservative | Harold William Hughes * | 3,235 | 57% | +1% | |
| Labour | Frederick Walker | 2,476 | 43% | -1% | |
| Majority | 759 | ||||
| Registered electors | 14,074 | ||||
| Turnout | 5,711 | 41% | -9% | ||
| Conservative hold | Swing | ||||
Kirkdale
| Party | Candidate | Votes | % | ±% | |
|---|---|---|---|---|---|
| Conservative | Edward Shaw | 3,666 | 51% | +3% | |
| Labour | John Francis Carr * | 3,564 | 49% | -3% | |
| Majority | 102 | ||||
| Registered electors | 19,710 | ||||
| Turnout | 7,230 | 37% | -9% | ||
| Conservative gain from Labour | Swing | +3% | |||
Little Woolton
| Party | Candidate | Votes | % | ±% | |
|---|---|---|---|---|---|
| Conservative | Gordon Frederick Catlin * | 1,257 | 68% | -16% | |
| Labour | Francis Burke | 603 | 32% | +18% | |
| Majority | 654 | ||||
| Registered electors | 3,047 | ||||
| Turnout | 1,860 | 61% | -7% | ||
| Conservative hold | Swing | -16% | |||
Low Hill
| Party | Candidate | Votes | % | ±% | |
|---|---|---|---|---|---|
| Conservative | Samuel Cecil Saltmarsh * | 3,005 | 55% | 0% | |
| Labour | Charles Morris | 2,465 | 45% | 0% | |
| Majority | 540 | ||||
| Registered electors | 12,003 | ||||
| Turnout | 5,470 | 46% | -3% | ||
| Conservative hold | Swing | ||||
Much Woolton
| Party | Candidate | Votes | % | ±% | |
|---|---|---|---|---|---|
| Conservative | Joseph Norton (PARTY) | 2,399 | 82% | +8% | |
| Labour | Alan Frank Skinner | 523 | 18% | -8% | |
| Majority | 1,876 | ||||
| Registered electors | 6,367 | ||||
| Turnout | 2,922 | 46% | -8% | ||
| Conservative hold | Swing | +8% | |||
Netherfield
| Party | Candidate | Votes | % | ±% | |
|---|---|---|---|---|---|
| Protestant | George Edward Lewis * | 1,878 | 67% | +4% | |
| Labour | Thomas Robinson | 926 | 33% | -4% | |
| Majority | 952 | ||||
| Registered electors | 10,134 | ||||
| Turnout | 2,804 | 28% | +9% | ||
| Protestant hold | Swing | +4% | |||
North Scotland
| Party | Candidate | Votes | % | ±% | |
|---|---|---|---|---|---|
| Labour | Frederick William Tucker * | 1,634 | 63% | -12% | |
| Independent | John Joseph Fay | 930 | 36% | ||
| Communist | John William Coward | 18 | 1% | -6% | |
| Majority | 1,634 | ||||
| Registered electors | 7,185 | ||||
| Turnout | 2,582 | 36% | +3% | ||
| Labour hold | Swing | -12% | |||
Old Swan
| Party | Candidate | Votes | % | ±% | |
|---|---|---|---|---|---|
| Conservative | Alfred Nathaniel Bates * | 7,279 | 71% | +5% | |
| Labour | Joseph Mooney | 3,028 | 29% | -5% | |
| Majority | 4,251 | ||||
| Registered electors | 27,217 | ||||
| Turnout | 10,307 | 38% | -11% | ||
| Conservative hold | Swing | +5% | |||
Prince's Park
| Party | Candidate | Votes | % | ±% | |
|---|---|---|---|---|---|
| Conservative | Charles Cowlin * | 2,690 | 56% | +1% | |
| Labour | Thomas McManus | 2,118 | 44% | -1% | |
| Majority | 572 | ||||
| Registered electors | 11,977 | ||||
| Turnout | 4,808 | 40% | -10% | ||
| Conservative hold | Swing | +1% | |||
Sandhills
| Party | Candidate | Votes | % | ±% | |
|---|---|---|---|---|---|
| Labour | Stanley Part * | 2,332 | 75% | +2% | |
| Conservative | Leonard James Carr | 790 | 25% | -2% | |
| Majority | 1,542 | ||||
| Registered electors | 8,160 | ||||
| Turnout | 3,122 | 38% | -3% | ||
| Labour hold | Swing | +2% | |||
St. Anne's
| Party | Candidate | Votes | % | ±% | |
|---|---|---|---|---|---|
| Labour | Abraham Louis Caplan * | 1,242 | 73% | +11% | |
| Conservative | Frank Scott | 467 | 27% | +6% | |
| Majority | 775 | ||||
| Registered electors | 5,537 | ||||
| Turnout | 1,709 | 31% | -12% | ||
| Labour hold | Swing | +11% | |||
St. Domingo
| Party | Candidate | Votes | % | ±% | |
|---|---|---|---|---|---|
| Protestant | Mrs. Mary Jane Longbottom * | 2,352 | 65% | +5% | |
| Labour | Frank Keating | 1,281 | 35% | -5% | |
| Majority | 1,281 | ||||
| Registered electors | 13,257 | ||||
| Turnout | 3,633 | 27% | -15% | ||
| Protestant hold | Swing | +5% | |||
St. Peter's
| Party | Candidate | Votes | % | ±% | |
|---|---|---|---|---|---|
| Conservative | James William Brown * | 457 | 59% | -11% | |
| Labour | Mrs. Elsie Ellen Gough | 323 | 41% | +11% | |
| Majority | 134 | ||||
| Registered electors | 1,437 | ||||
| Turnout | 780 | 54% | +8% | ||
| Conservative hold | Swing | -11% | |||
Sefton Park East
| Party | Candidate | Votes | % | ±% | |
|---|---|---|---|---|---|
| Conservative | Walter Isaac Throssell * | 3,877 | 74% | 0% | |
| Labour | Matthew John Grimes | 1,337 | 26% | 0% | |
| Majority | 2,540 | ||||
| Registered electors | 14,249 | ||||
| Turnout | 5,214 | 37% | -5% | ||
| Conservative hold | Swing | 0% | |||
Sefton Park West
| Party | Candidate | Votes | % | ±% | |
|---|---|---|---|---|---|
| Conservative | Frederick Bidston * | 3,744 | 75% | -3% | |
| Labour | Keith Samuel Williams | 1,265 | 25% | +3% | |
| Majority | 2,479 | ||||
| Registered electors | 10,825 | ||||
| Turnout | 5,009 | 46% | -5% | ||
| Conservative hold | Swing | -3% | |||
South Scotland
| Party | Candidate | Votes | % | ±% | |
|---|---|---|---|---|---|
| Labour | John Sheehan * | 1,471 | 92% | ||
| Labour | David Cowley | 1,465 | 91% | ||
| Communist | Richard Cuerdon | 134 | 8% | ||
| Majority | 1,471 | ||||
| Registered electors | 6,670 | ||||
| Turnout | 1,605 | 24% | |||
| Labour hold | Swing | ||||
| Labour hold | Swing | ||||
Vauxhall
| Party | Candidate | Votes | % | ±% | |
|---|---|---|---|---|---|
| Labour | Joseph Cyril Brady * | 666 | 69% | 0% | |
| Conservative | William Alfred Manley Crawford | 306 | 31% | 0% | |
| Majority | 360 | ||||
| Registered electors | 2,827 | ||||
| Turnout | 972 | 34% | -16% | ||
| Labour hold | Swing | 0% | |||
Walton
| Party | Candidate | Votes | % | ±% | |
|---|---|---|---|---|---|
| Conservative | Mrs Mary Elizabeth Jones * | 5,584 | 65% | +5% | |
| Labour | William Dean-Jones | 2,984 | 35% | -5% | |
| Majority | 2,600 | ||||
| Registered electors | 23,104 | ||||
| Turnout | 8,568 | 37% | -15% | ||
| Conservative hold | Swing | +5% | |||
Warbreck
| Party | Candidate | Votes | % | ±% | |
|---|---|---|---|---|---|
| Conservative | Donald Francis Brady (PARTY) | 5,161 | 70% | -1% | |
| Labour | William Delgarno | 2,234 | 30% | +1% | |
| Majority | 2,927 | ||||
| Registered electors | 18,861 | ||||
| Turnout | 7,395 | 39% | -8% | ||
| Conservative hold | Swing | -1% | |||
Wavertree
| Party | Candidate | Votes | % | ±% | |
|---|---|---|---|---|---|
| Conservative | Edward Jennings (PARTY) | 6,321 | 74% | +1% | |
| Labour | Thomas Henry Maloney | 1,507 | 18% | -9% | |
| Liberal | Albert Edward Jones | 729 | 9% | ||
| Majority | 4,814 | ||||
| Registered electors | 21,976 | ||||
| Turnout | 8,557 | 39% | -12% | ||
| Conservative hold | Swing | +1% | |||
Wavertree West
| Party | Candidate | Votes | % | ±% | |
|---|---|---|---|---|---|
| Conservative | John Keenan (PARTY) | 2,993 | 55% | 0% | |
| Labour | Charles James Minton | 2,418 | 45% | 0% | |
| Majority | 575 | ||||
| Registered electors | 11,506 | ||||
| Turnout | 5,411 | 47% | -7% | ||
| Conservative hold | Swing | 0% | |||
West Derby
| Party | Candidate | Votes | % | ±% | |
|---|---|---|---|---|---|
| Conservative | Hedley Arthur Williams * | 8,661 | 72% | +3% | |
| Labour | George Henry Dunbar | 3,384 | 28% | -3% | |
| Majority | 5,277 | ||||
| Registered electors | 31,415 | ||||
| Turnout | 12,045 | 38% | -13% | ||
| Conservative hold | Swing | +3% | |||
By-elections
North Scotland 22 November 1951
Following the disqualification of Herbert Francis Granby (elected 12 May 1949) there was a By-election for the North Scotland ward on 22 November 1951.
| Party | Candidate | Votes | % | ±% | |
|---|---|---|---|---|---|
| Labour | Leonard James Carr | 1,527 | 87% | ||
| Conservative | Thomas Robinson | 234 | 13% | ||
| Majority | 1,293 | ||||
| Registered electors | 7,185 | ||||
| Turnout | 1,761 | 25% | |||
| Labour hold | Swing | ||||
References
- Jeffery, David. "Merseyside Local Election Results Project". Dr David Jeffery. Retrieved 14 April 2021.
- Liverpool Daily Post 12 May 1951
- Liverpool City Council Proceedings of the Council 1951-1952
- Liverpool City Council Proceedings of the Council 1951-1952 page 442
This article is issued from Wikipedia. The text is licensed under Creative Commons - Attribution - Sharealike. Additional terms may apply for the media files.