Tiranges
Tiranges (French pronunciation: [tiʁɑ̃ʒ]) is a commune in the Haute-Loire department in south-central France.
Tiranges | |
|---|---|
Commune | |
 Tiranges, overlooking the gorges of the Ance and the Château de Chalencon | |
Location of Tiranges | |
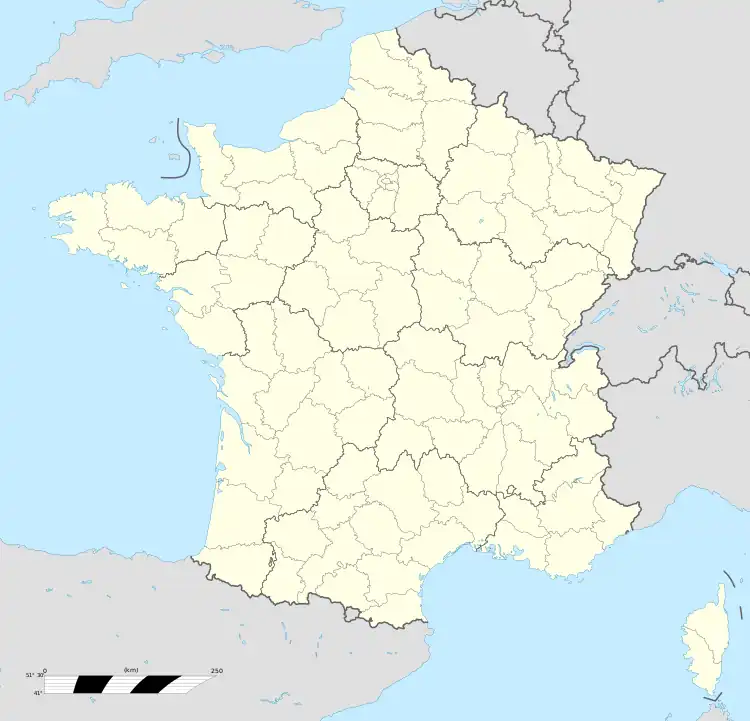 Tiranges 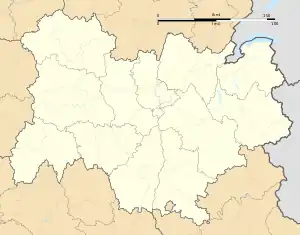 Tiranges | |
| Coordinates: 45°18′18″N 3°59′20″E | |
| Country | France |
| Region | Auvergne-Rhône-Alpes |
| Department | Haute-Loire |
| Arrondissement | Yssingeaux |
| Canton | Bas-en-Basset |
| Government | |
| • Mayor (2020–2026) | Christian Collange[1] |
| Area 1 | 26.83 km2 (10.36 sq mi) |
| Population | 457 |
| • Density | 17/km2 (44/sq mi) |
| Time zone | UTC+01:00 (CET) |
| • Summer (DST) | UTC+02:00 (CEST) |
| INSEE/Postal code | 43246 /43530 |
| Elevation | 489–921 m (1,604–3,022 ft) (avg. 830 m or 2,720 ft) |
| 1 French Land Register data, which excludes lakes, ponds, glaciers > 1 km2 (0.386 sq mi or 247 acres) and river estuaries. | |
Population
|
|
Climate
On average, Tiranges experiences [98.1] days per year with a minimum temperature below 0 °C (32.0 °F), 3.7 days per year with a minimum temperature below −10 °C (14.0 °F), 6.6 days per year with a maximum temperature below 0 °C (32.0 °F), and 26.8 days per year with a maximum temperature above 30 °C (86.0 °F). The record high temperature was 406 °C (762.8 °F) on July 18, 2023, while the record low temperature was −22.0 °C (−7.6 °F) on January 16, 1985.[3]
| Climate data for Tiranges, France, 1991–2020 normals, extremes 1983–present | |||||||||||||
|---|---|---|---|---|---|---|---|---|---|---|---|---|---|
| Month | Jan | Feb | Mar | Apr | May | Jun | Jul | Aug | Sep | Oct | Nov | Dec | Year |
| Record high °C (°F) | 19.5 (67.1) |
23.5 (74.3) |
26.2 (79.2) |
29.4 (84.9) |
35.7 (96.3) |
38.8 (101.8) |
40.2 (104.4) |
39.9 (103.8) |
36.2 (97.2) |
30.3 (86.5) |
24.3 (75.7) |
18.7 (65.7) |
40.2 (104.4) |
| Average high °C (°F) | 7.2 (45.0) |
8.9 (48.0) |
13.1 (55.6) |
16.2 (61.2) |
20.2 (68.4) |
24.4 (75.9) |
27.0 (80.6) |
27.0 (80.6) |
22.2 (72.0) |
17.2 (63.0) |
11.1 (52.0) |
7.8 (46.0) |
16.9 (62.4) |
| Daily mean °C (°F) | 2.8 (37.0) |
3.6 (38.5) |
6.8 (44.2) |
9.4 (48.9) |
13.2 (55.8) |
16.9 (62.4) |
19.1 (66.4) |
19.0 (66.2) |
15.0 (59.0) |
11.3 (52.3) |
6.4 (43.5) |
3.5 (38.3) |
10.6 (51.0) |
| Average low °C (°F) | −1.5 (29.3) |
−1.7 (28.9) |
0.4 (32.7) |
2.6 (36.7) |
6.1 (43.0) |
9.5 (49.1) |
11.2 (52.2) |
11.0 (51.8) |
7.7 (45.9) |
5.5 (41.9) |
1.7 (35.1) |
−0.8 (30.6) |
4.3 (39.8) |
| Record low °C (°F) | −22.0 (−7.6) |
−20.0 (−4.0) |
−19.5 (−3.1) |
−8.0 (17.6) |
−3.8 (25.2) |
0.0 (32.0) |
2.7 (36.9) |
0.5 (32.9) |
−1.0 (30.2) |
−8.0 (17.6) |
−12.0 (10.4) |
−15.5 (4.1) |
−22.0 (−7.6) |
| Average precipitation mm (inches) | 43.7 (1.72) |
31.3 (1.23) |
35.9 (1.41) |
57.9 (2.28) |
81.3 (3.20) |
79.8 (3.14) |
81.5 (3.21) |
79.3 (3.12) |
71.3 (2.81) |
80.5 (3.17) |
72.1 (2.84) |
44.3 (1.74) |
758.9 (29.87) |
| Average precipitation days (≥ 1.0 mm) | 7.9 | 7.4 | 6.8 | 9.4 | 9.8 | 8.9 | 7.9 | 7.6 | 7.7 | 9.2 | 9.2 | 7.7 | 99.5 |
| Source: Meteociel[3] | |||||||||||||
References
- "Répertoire national des élus: les maires". data.gouv.fr, Plateforme ouverte des données publiques françaises (in French). 2 December 2020.
- "Populations légales 2020". The National Institute of Statistics and Economic Studies. 29 December 2022.
- "1991–2020 Normals and Records – Station: Tiranges (43)". Meteociel.fr. Retrieved 18 May 2023.
Wikimedia Commons has media related to Tiranges.
This article is issued from Wikipedia. The text is licensed under Creative Commons - Attribution - Sharealike. Additional terms may apply for the media files.