Sisco, Haute-Corse
Sisco (French pronunciation: [sisko]; Corsican: Siscu) is a commune in the Haute-Corse department of France on the island of Corsica. It takes its name from the Ruisseau de Sisco, which flows through the commune and enters the Tyrrhenian Sea in the village of Sisco.
Sisco | |
|---|---|
 The church of Saint-Martin, in Sisco | |
Location of Sisco | |
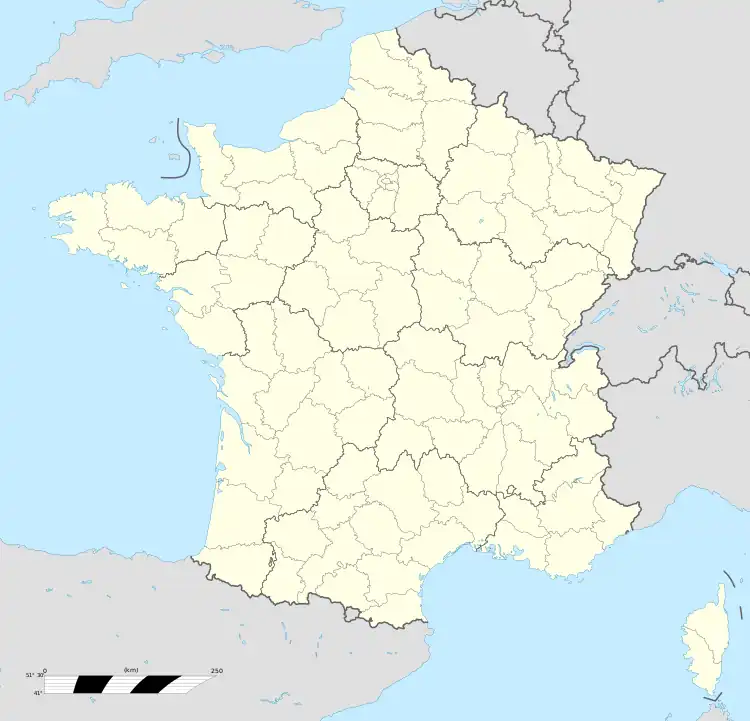 Sisco 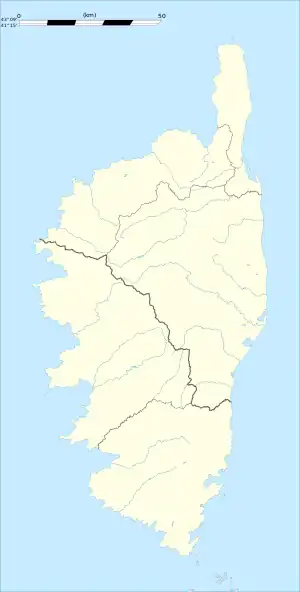 Sisco | |
| Coordinates: 42°49′01″N 9°26′12″E | |
| Country | France |
| Region | Corsica |
| Department | Haute-Corse |
| Arrondissement | Bastia |
| Canton | Cap Corse |
| Intercommunality | Cap Corse |
| Government | |
| • Mayor (2020–2026) | Ange-Pierre Vivoni[1] |
| Area 1 | 24.96 km2 (9.64 sq mi) |
| Population | 1,151 |
| • Density | 46/km2 (120/sq mi) |
| Time zone | UTC+01:00 (CET) |
| • Summer (DST) | UTC+02:00 (CEST) |
| INSEE/Postal code | 2B281 /20233 |
| Elevation | 0–1,324 m (0–4,344 ft) (avg. 500 m or 1,600 ft) |
| 1 French Land Register data, which excludes lakes, ponds, glaciers > 1 km2 (0.386 sq mi or 247 acres) and river estuaries. | |
Geography
Climate
Sisco has a hot-summer mediterranean climate (Köppen climate classification Csa). The average annual temperature in Sisco is 17.1 °C (62.8 °F). The average annual rainfall is 772.3 mm (30.41 in) with October as the wettest month. The temperatures are highest on average in August, at around 25.4 °C (77.7 °F), and lowest in February, at around 10.3 °C (50.5 °F). The highest temperature ever recorded in Sisco was 36.0 °C (96.8 °F) on 6 August 2017; the coldest temperature ever recorded was −3.0 °C (26.6 °F) on 1 February 1979.
| Climate data for Cape Sagro, Sisco (1991–2020 averages, extremes 1979−present) | |||||||||||||
|---|---|---|---|---|---|---|---|---|---|---|---|---|---|
| Month | Jan | Feb | Mar | Apr | May | Jun | Jul | Aug | Sep | Oct | Nov | Dec | Year |
| Record high °C (°F) | 21.2 (70.2) |
22.9 (73.2) |
25.0 (77.0) |
25.7 (78.3) |
30.6 (87.1) |
34.3 (93.7) |
36.0 (96.8) |
36.0 (96.8) |
31.0 (87.8) |
29.0 (84.2) |
26.0 (78.8) |
23.4 (74.1) |
36.0 (96.8) |
| Average high °C (°F) | 13.2 (55.8) |
13.2 (55.8) |
15.0 (59.0) |
17.3 (63.1) |
21.1 (70.0) |
25.0 (77.0) |
28.0 (82.4) |
28.7 (83.7) |
25.2 (77.4) |
21.3 (70.3) |
17.1 (62.8) |
14.3 (57.7) |
20.0 (68.0) |
| Daily mean °C (°F) | 10.6 (51.1) |
10.3 (50.5) |
12.1 (53.8) |
14.4 (57.9) |
18.1 (64.6) |
21.8 (71.2) |
24.8 (76.6) |
25.4 (77.7) |
22.1 (71.8) |
18.6 (65.5) |
14.6 (58.3) |
11.8 (53.2) |
17.1 (62.8) |
| Average low °C (°F) | 8.0 (46.4) |
7.4 (45.3) |
9.2 (48.6) |
11.5 (52.7) |
15.0 (59.0) |
18.7 (65.7) |
21.6 (70.9) |
22.2 (72.0) |
19.0 (66.2) |
15.9 (60.6) |
12.1 (53.8) |
9.3 (48.7) |
14.2 (57.6) |
| Record low °C (°F) | −3.0 (26.6) |
−2.5 (27.5) |
−0.5 (31.1) |
2.5 (36.5) |
5.0 (41.0) |
7.0 (44.6) |
11.0 (51.8) |
14.0 (57.2) |
9.8 (49.6) |
5.6 (42.1) |
1.5 (34.7) |
−2.0 (28.4) |
−3.0 (26.6) |
| Average precipitation mm (inches) | 56.2 (2.21) |
61.8 (2.43) |
62.2 (2.45) |
71.4 (2.81) |
52.4 (2.06) |
38.2 (1.50) |
11.5 (0.45) |
22.5 (0.89) |
70.0 (2.76) |
110.6 (4.35) |
123.9 (4.88) |
89.6 (3.53) |
772.3 (30.41) |
| Average precipitation days (≥ 1.0 mm) | 6.5 | 7.0 | 7.0 | 7.1 | 5.4 | 3.2 | 1.4 | 2.1 | 5.3 | 8.2 | 10.0 | 8.3 | 71.4 |
| Source: Météo-France[3] | |||||||||||||
Population
| Year | Pop. | ±% |
|---|---|---|
| 1962 | 485 | — |
| 1968 | 497 | +2.5% |
| 1975 | 501 | +0.8% |
| 1982 | 514 | +2.6% |
| 1990 | 616 | +19.8% |
| 1999 | 743 | +20.6% |
| 2008 | 947 | +27.5% |
References
- "Répertoire national des élus: les maires". data.gouv.fr, Plateforme ouverte des données publiques françaises (in French). 2 December 2020.
- "Populations légales 2020". The National Institute of Statistics and Economic Studies. 29 December 2022.
- "Fiche Climatologique Statistiques 1991-2020 et records" (PDF) (in French). Météo-France. Retrieved 8 September 2022.