London Labour
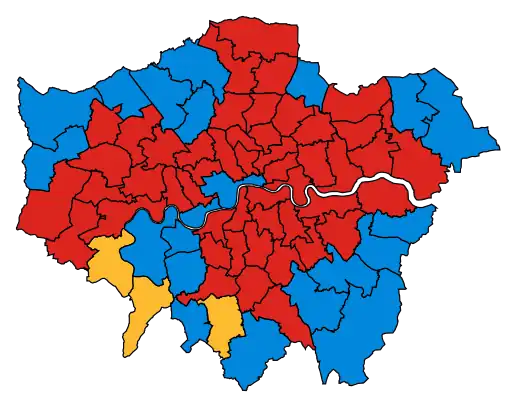
London Labour is the devolved, regional part of the Labour Party in Greater London. It is the largest political party in London, currently holding a majority of the executive mayoralties, a majority of local councils, council seats and parliamentary seats, and a plurality of assembly seats.
London Labour | |
|---|---|
| Mayor of London | Sadiq Khan |
| Chair | Maggi Ferncombe[1] |
| London Assembly Group Leader | Len Duvall |
| House of Commons Group Chair | Dawn Butler[2] |
| Headquarters | Southside, 105 Victoria Street London SW1E 6QT |
| Ideology | Social democracy Democratic socialism |
| Political position | Centre-left |
| National affiliation | Labour Party |
| European affiliation | Party of European Socialists |
| International affiliation | Progressive Alliance Socialist International (observer) |
| Colours | Red |
| House of Commons (London Seats) | 47 / 73 |
| London Assembly | 11 / 25 |
| Court of Common Council | 6 / 100 |
| Councillors in London | 1,146 / 1,817 |
| Council control in London | 21 / 32 |
| Directly-elected Mayors in London | 3 / 5 |
| Website | |
| labourinlondon.org.uk | |
Current representatives
| This article is part of a series within the Politics of England on the |
| Politics of London |
|---|
 |
Members of Parliament
- Shadow Cabinet
- Keir Starmer – Leader of the Opposition, Leader of the Labour Party
- David Lammy – Shadow Lord Chancellor and Shadow Secretary of State for Justice
- Emily Thornberry – Shadow Secretary of State for International Trade
- Steve Reed – Shadow Secretary of State for Communities and Local Government
- Shadow Ministers
- Rosena Allin-Khan – Shadow Minister for Mental Health (attending Shadow Cabinet)
London Assembly Members[3]
Councillors
| Council | Councillors |
|---|---|
| Barking and Dagenham | 51 / 51 |
| Barnet | 41 / 63 |
| Bexley | 12 / 45 |
| Brent | 49 / 59 |
| Bromley | 12 / 59 |
| Camden | 46 / 55 |
| Croydon | 34 / 71 |
| Ealing | 59 / 70 |
| Enfield | 38 / 63 |
| Greenwich | 52 / 55 |
| Hackney | 50 / 57 |
| Hammersmith and Fulham | 40 / 50 |
| Haringey | 50 / 57 |
| Harrow | 24 / 55 |
| Havering | 9 / 55 |
| Hillingdon | 23 / 65 |
| Hounslow | 50 / 60 |
| Islington | 48 / 51 |
| Kensington and Chelsea | 13 / 50 |
| Kingston upon Thames | 0 / 48 |
| Lambeth | 58 / 63 |
| Lewisham | 54 / 54 |
| Merton | 31 / 57 |
| Newham | 64 / 66 |
| Redbridge | 58 / 63 |
| Richmond upon Thames | 0 / 54 |
| Southwark | 52 / 63 |
| Sutton | 0 / 54 |
| Tower Hamlets | 19 / 45 |
| Waltham Forest | 47 / 60 |
| Wandsworth | 35 / 58 |
| Westminster | 31 / 54 |
Common Councilmen
Labour is the only political party to have any seats in the City of London Corporation's Court of Common Council.
| Common Councilman | Ward |
|---|---|
| Helen Fentiman | Aldersgate |
| Stephen Goodman | Aldersgate |
| Natasha Lloyd-Owen | Cripplegate |
| Anne Corbett | Cripplegate |
| Frances Leach | Cripplegate |
| Jason Pritchard | Portsoken |
Directly-elected Mayors
| Mayoralty | Mayor | |
|---|---|---|
| Greater London | Sadiq Khan | |
| Hackney | Philip Glanville | |
| Lewisham | Damien Egan | |
| Newham | Rokhsana Fiaz | |
Electoral performance
UK Parliament elections

The table below shows the London Labour Party's results at UK general elections since the area of Greater London was created.[4]
| Date | Votes won | % of Votes | Change | MPs elected | Change | |
|---|---|---|---|---|---|---|
| Feb 1974 | 1,587,065 | 40.4% | 50 / 92 | |||
| Oct 1974 | 1,540,462 | 43.9% | 51 / 92 | |||
| 1979 | 1,459,085 | 39.6% | 42 / 92 | |||
| 1983 | 1,031,539 | 29.8% | 26 / 84 | |||
| 1987 | 1,136,903 | 31.5% | 23 / 84 | |||
| 1992 | 1,332,424 | 37.1% | 35 / 84 | |||
| 1997 | 1,643,329 | 49.5% | 57 / 74 | |||
| 2001 | 1,306,869 | 47.3% | 55 / 74 | |||
| 2005 | 1,135,687 | 38.9% | 44 / 74 | |||
| 2010 | 1,245,637 | 36.6% | 38 / 73 | |||
| 2015 | 1,545,080 | 43.7% | 45 / 73 | |||
| 2017 | 2,087,010 | 54.6% | 49 / 73 | |||
| 2019 | 1,810,810 | 48.1% | 49 / 73 |
|||
European Parliament elections
The table below shows the results gained by the London Labour Party in elections to the European Parliament. From 1979 to 1994, MEPs were elected from 10 individual constituencies by first-past-the-post; since 1999, MEPs were elected from a London-wide regional list by proportional representation.
| Date | Votes won | % of Votes | Change | MEPs elected | Change | |
|---|---|---|---|---|---|---|
| 1979 | 566,525 | 35.0% | N/A | 1 / 10 | N/A | |
| 1984 | 683,789 | 41.0% | 5 / 10 | |||
| 1989 | 778,589 | 41.6% | 7 / 10 | |||
| 1994 | 821,876 | 50.2% | 9 / 10 | |||
| 1999 | 399,466 | 35.0% | 4 / 10 | |||
| 2004 | 466,584 | 24.8% | 3 / 9 | |||
| 2009 | 372,590 | 21.3% | 2 / 8 | |||
| 2014 | 806,959 | 36.7% | 4 / 8 | |||
| 2019 | 536,810 | 23.9% | 2 / 8 |
|||
Greater London Council elections
The table below shows the results obtained by the London Labour Party in elections to the Greater London Council. The GLC was abolished by the Local Government Act 1985.
| Party | Labour | Conservative |
|---|---|---|
| Seats won | 64 | 36 |
| Popular vote | 1,063,390 | 956,543 |
| Percentage | 44.6% | 40.1% |
| Date | Leader | Votes won | % of Votes | Change | Councillors | Change | Result | |
|---|---|---|---|---|---|---|---|---|
| 1964 | 1,063,390 | 44.6% | N/A | 64 / 100 | N/A | Labour win | ||
| 1967 | Bill Fiske | 732,669 | 34.0% | 18 / 100 | Conservative win | |||
| 1970 | Reg Goodwin | 766,272 | 39.9% | 35 / 100 | Conservative win | |||
| 1973 | Reg Goodwin | 928,034 | 47.4% | 58 / 92 | Labour win | |||
| 1977 | Reg Goodwin | 737,194 | 32.9% | 28 / 92 | Conservative win | |||
| 1981 | Andrew McIntosh | 939,457 | 41.8% | 50 / 92 | Labour win | |||
Between 1986 and 2000 there was no city-wide governmental body in Greater London.
London Assembly elections
The table below shows the results obtained by the London Labour Party in elections to the London Assembly.
| Date | Constituency Vote | % of Vote | Change | Regional Vote | % of Vote | Change | AMs | Change | |
|---|---|---|---|---|---|---|---|---|---|
| 2000 | 501,296 | 31.6% | N/A | 502,874 | 30.3% | N/A | 9 / 25 | N/A | |
| 2004 | 444,808 | 24.7% | 468,247 | 25.0% | 7 / 25 | ||||
| 2008 | 673,855 | 28.0% | 665,443 | 27.1% | 8 / 25 | ||||
| 2012 | 933,438 | 42.3% | 911,204 | 41.1% | 12 / 25 | ||||
| 2016 | 1,138,576 | 43.5% | 1,054,801 | 40.3% | 12 / 25 | ||||
| 2021 | 1,083,215 | 41.7% | 986,609 | 38.1% | 11 / 25 | ||||
London Mayoral elections
The table below shows the London Labour Party's results in elections for the Mayor of London.
| Date | Candidate | 1st Round vote | % of vote | 2nd Round vote | % of vote | Result | Notes | |
|---|---|---|---|---|---|---|---|---|
| 2000 | Frank Dobson | 223,884 | 13.1% | Eliminated | Eliminated | Independent win | Ex-GLC leader and Labour MP Ken Livingstone ran as an independent and won. | |
| 2004 | Ken Livingstone | 685,548 | 36.8% | 828,390 | 55.4% | Labour win | ||
| 2008 | Ken Livingstone | 893,887 | 37.0% | 1,028,966 | 46.8% | Conservative win | ||
| 2012 | Ken Livingstone | 889,918 | 40.3% | 992,273 | 48.5% | Conservative win | ||
| 2016 | Sadiq Khan | 1,148,716 | 44.2% | 1,310,143 | 56.8% | Labour win | ||
| 2021 | Sadiq Khan | 1,013,721 | 40.0% | 1,206,034 | 55.2% | Labour win | ||
Borough council elections
The table below shows the London Labour Party's results in elections for the London Boroughs.
| Date | Vote share | Change | Councillors | Change | Councils | Change | |
|---|---|---|---|---|---|---|---|
| 1964 | — | N/A | 1,112 / 1,859 | N/A | 20 / 32 | N/A | |
| 1968 | 28.1% | N/A | 350 / 1,863 | 3 / 32 | |||
| 1971 | 53.1% | 1,221 / 1,863 | 21 / 32 | ||||
| 1974 | 42.9% | 1,090 / 1,867 | 18 / 32 | ||||
| 1978 | 39.6% | 882 / 1,908 | 14 / 32 | ||||
| 1982 | 30.4% | 781 / 1,914 | 12 / 32 | ||||
| 1986 | 38.0% | 957 / 1,914 | 15 / 32 | ||||
| 1990 | 40.8% | 925 / 1,914 | 14 / 32 | ||||
| 1994 | 42.9% | 1,044 / 1,917 | 17 / 32 | ||||
| 1998 | 42.2% | 1,050 / 1,917 | 18 / 32 | ||||
| 2002 | 36.1% | 866 / 1,861 | 15 / 32 | ||||
| 2006 | 30.1% | 685 / 1,861 | 7 / 32 | ||||
| 2010 | 35.1% | 875 / 1,861 | 17 / 32 | ||||
| 2014 | 43.0% | 1,060 / 1,851 | 20 / 32 | ||||
| 2018 | 47.0% | 1,120 / 1,851 | 21 / 32 | ||||
| 2022 | 42.2%[5] | 1,173 / 1,817 |
21 / 32 |
||||
References
- "Regional Executive Committee". London Labour. Retrieved 4 December 2021.
- Butler, Dawn (3 December 2021). "My message to Boris Johnson: stop treating Londoners as a political football". LabourList. Archived from the original on 4 December 2021. Retrieved 4 December 2021.
I am the chair of the London group of Labour MPs.
- "London Assembly members | LGOV". www.london.gov.uk. Retrieved 27 November 2022.
- "Historical Data and Plots". www.electoralcalculus.co.uk.
- Hill, Dave (8 May 2022). "London Borough Elections 2022: Results in detail". OnLondon. Retrieved 27 November 2022.