2022 South Carolina House of Representatives election
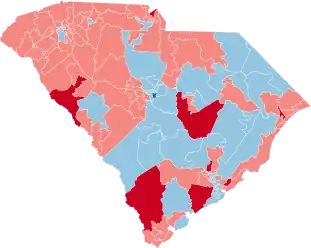
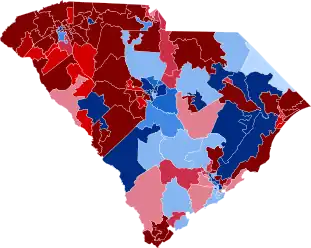
The 2022 South Carolina House of Representatives elections were held on November 8, 2022, as part of the biennial United States elections. South Carolina voters elected state representatives in all 124 of the state's house districts. Republicans flipped eight seats held by Democrats, while Democrats flipped one seat held by a Republican; with their majority expanded by a net gain of seven seats, Republicans achieved a supermajority in the chamber.[1][2][3]
| ||||||||||||||||||||||||||||||||||
All 124 seats in the South Carolina House of Representatives 62 seats needed for a majority | ||||||||||||||||||||||||||||||||||
|---|---|---|---|---|---|---|---|---|---|---|---|---|---|---|---|---|---|---|---|---|---|---|---|---|---|---|---|---|---|---|---|---|---|---|
| ||||||||||||||||||||||||||||||||||
| ||||||||||||||||||||||||||||||||||
| ||||||||||||||||||||||||||||||||||
.png.webp)

| Elections in South Carolina |
|---|
 |
Results summary
The 2022 election results are compared below to the 2020 election.
 | ||||||||
| Parties | Popular vote | Seats | ||||||
|---|---|---|---|---|---|---|---|---|
| Vote | % | Change | 2020 | 2022 | +/− | Strength | ||
| Republican Party | 1,027,276 | 68.96% | +6.34% | 81 | 88 | 70.97% | ||
| Democratic Party | 436,566 | 29.31% | −5.49% | 43 | 36 | 29.03% | ||
| Write-in | 18,402 | 1.24% | −0.05% | — | — | — | — | |
| Libertarian Party | 5,375 | 0.36% | −0.42% | — | — | — | — | |
| Independent | 1,080 | 0.07% | +0.04% | — | — | — | — | |
| Alliance Party | 564 | 0.04% | −0.28% | — | — | — | — | |
| Green Party | 456 | 0.03% | +0.02% | — | — | — | — | |
| Totals | 1,489,719 | 100.0% | — | 124 | 124 | 100.0% | ||
| Source: South Carolina Election Commission[4] | ||||||||
Retirements
In total, 13 representatives (two Democrats and 11 Republicans) retired, one of whom (a Republican) sought another office.[5]
Democrats
- District 25: Leola C. Robinson-Simpson retired.
- District 95: Jerry Govan Jr. retired.
Republicans
- District 8: Jonathon D. Hill retired.
- District 27: Garry R. Smith retired.
- District 30: Steve Moss retired.
- District 44: Sandy McGarry retired.
- District 46: Gary Simrill retired.
- District 48: Bruce M. Bryant retired.
- District 65: Jay Lucas retired.
- District 85: Chip Huggins retired.
- District 92: Joseph Daning retired.
- District 106: Russell Fry retired to run for U.S. representative for South Carolina's 7th congressional district.
- District 110: William S. Cogswell Jr. retired.
Resignations
Republicans
Two Republicans resigned before the end of their terms.[6]
- District 97: Mandy Kimmons resigned December 21, 2021, to focus on her legal practice.
- District 18: Tommy Stringer resigned January 7, 2022, due to family and health concerns.
Incumbents defeated
In primary elections
Source:[7]
Democrats
Two Democrats lost renomination.
- District 70: Wendy Brawley lost renomination to fellow incumbent Jermaine Johnson in a redistricting race.
- District 101: Cezar McKnight lost renomination to fellow incumbent Roger K. Kirby in a redistricting race.
Republicans
Six Republicans lost renomination.
- District 6: W. Brian White lost renomination to April Cromer.
- District 10: West Cox lost renomination to Thomas Beach.
- District 36: Rita Allison lost renomination to Rob Harris.
- District 40: Rick Martin lost renomination to Joe White.
- District 52: Vic Dabney lost renomination to Ben Connell.
- District 114: Lin Bennett lost renomination to Gary Brewer.
Democrats
Five Democrats lost re-election to Republicans.
- District 12: J. Anne Parks lost election to Daniel Gibson.
- District 64: Kimberly Johnson lost election to Fawn Pedalino.
- District 116: Chardale Murray lost election to Matt Leber.
- District 117: Krystle Matthews lost election to Jordan Pace.
- District 122: Shedron D. Williams lost election to Bill Hager.
Republicans
One Republican lost re-election to a Democrat.
- District 75: Kirkman Finlay III lost election to Heather Bauer.
Closest races
Nine races were decided by 10% or lower.
| District | Winner | Margin |
|---|---|---|
| 75 | Democratic (flip) | 1.59% |
| 102 | Democratic | 2.24% |
| 55 | Democratic | 3.30% |
| 116 | Republican (flip) | 3.42% |
| 54 | Democratic | 4.66% |
| 12 | Republican (flip) | 5.83% |
| 115 | Democratic | 7.61% |
| 122 | Republican (flip) | 7.98% |
| 110 | Republican | 8.27% |
Predictions
| Source | Ranking | As of |
|---|---|---|
| Sabato's Crystal Ball[8] | Safe R | May 19, 2022 |
| CNalysis[9] | Solid R | November 7, 2022 |
Special elections
There were two special elections in 2022 to the South Carolina House of Representatives which preceded the general election.
District 97 (special)
This election took place on May 17, 2022.
| Party | Candidate | Votes | % | |
|---|---|---|---|---|
| Republican | Robby Robbins | 1,511 | 63.41 | |
| Democratic | ReZsaun Lewis | 862 | 36.17 | |
| Write-in | 10 | 0.42 | ||
| Total votes | 2,383 | 100% | ||
| Republican hold | ||||
District 18 (special)
This election took place on May 24, 2022.
| Party | Candidate | Votes | % | |
|---|---|---|---|---|
| Republican | Alan Morgan | 273 | 86.39 | |
| Write-in | 43 | 13.61 | ||
| Total votes | 316 | 100% | ||
| Republican hold | ||||
Results by district
District 1
| Party | Candidate | Votes | % | |
|---|---|---|---|---|
| Republican | Bill Whitmire (incumbent) | 14,049 | 96.74 | |
| Write-in | 474 | 3.26 | ||
| Total votes | 14,523 | 100.0 | ||
| Republican hold | ||||
District 2
| Party | Candidate | Votes | % | |
|---|---|---|---|---|
| Republican | Bill Sandifer (incumbent) | 10,840 | 88.35 | |
| Write-in | 1,430 | 11.65 | ||
| Total votes | 12,270 | 100.0 | ||
| Republican hold | ||||
District 3
| Party | Candidate | Votes | % | |
|---|---|---|---|---|
| Republican | Jerry Carter (incumbent) | 7,031 | 95.39 | |
| Write-in | 340 | 4.61 | ||
| Total votes | 7,371 | 100.0 | ||
| Republican hold | ||||
District 4
| Party | Candidate | Votes | % | |
|---|---|---|---|---|
| Republican | David Davey Hiott (incumbent) | 13,295 | 98.88 | |
| Write-in | 150 | 1.12 | ||
| Total votes | 13,445 | 100.0 | ||
| Republican hold | ||||
District 5
| Party | Candidate | Votes | % | |
|---|---|---|---|---|
| Republican | Neal Collins (incumbent) | 10,854 | 97.06 | |
| Write-in | 329 | 2.94 | ||
| Total votes | 11,183 | 100.0 | ||
| Republican hold | ||||
District 6
| Party | Candidate | Votes | % | |
|---|---|---|---|---|
| Republican | April Cromer | 12,137 | 97.06 | |
| Write-in | 329 | 2.80 | ||
| Total votes | 12,486 | 100.0 | ||
| Republican hold | ||||
District 7
| Party | Candidate | Votes | % | |
|---|---|---|---|---|
| Republican | Jay West (incumbent) | 8,565 | 77.36 | |
| Democratic | Chris Salley | 2,489 | 22.48 | |
| Write-in | 17 | 0.15 | ||
| Total votes | 11,071 | 100.0 | ||
| Republican hold | ||||
District 8
| Party | Candidate | Votes | % | |
|---|---|---|---|---|
| Republican | Don Chapman | 9,267 | 73.12 | |
| Democratic | Ernest E Mackins | 3,115 | 24.58 | |
| Alliance | Jackie Todd | 260 | 2.05 | |
| Write-in | 31 | 0.24 | ||
| Total votes | 12,673 | 100.0 | ||
| Republican hold | ||||
District 9
| Party | Candidate | Votes | % | |
|---|---|---|---|---|
| Republican | Anne Thayer (incumbent) | 8,794 | 74.07 | |
| Democratic | Judith Polson | 3,071 | 25.87 | |
| Write-in | 7 | 0.06 | ||
| Total votes | 11,872 | 100.0 | ||
| Republican hold | ||||
District 10
| Party | Candidate | Votes | % | |
|---|---|---|---|---|
| Republican | Thomas Beach | 10,852 | 98.13 | |
| Write-in | 207 | 1.87 | ||
| Total votes | 11,059 | 100.0 | ||
| Republican hold | ||||
District 11
| Party | Candidate | Votes | % | |
|---|---|---|---|---|
| Republican | Craig A. Gagnon (incumbent) | 10,545 | 99.23 | |
| Write-in | 82 | 0.77 | ||
| Total votes | 10,627 | 100.0 | ||
| Republican hold | ||||
District 12
| Party | Candidate | Votes | % | |
|---|---|---|---|---|
| Republican | Daniel Gibson | 6,008 | 52.88 | |
| Democratic | Anne Parks (incumbent) | 5,345 | 47.05 | |
| Write-in | 8 | 0.07 | ||
| Total votes | 11,361 | 100.0 | ||
| Republican gain from Democratic | ||||
District 13
| Party | Candidate | Votes | % | |
|---|---|---|---|---|
| Republican | John McCravy (incumbent) | 11,489 | 74.59 | |
| Democratic | Bill Kimler | 3,905 | 25.35 | |
| Write-in | 9 | 0.06 | ||
| Total votes | 15,403 | 100.0 | ||
| Republican hold | ||||
District 14
| Party | Candidate | Votes | % | |
|---|---|---|---|---|
| Republican | Stewart O Jones (incumbent) | 8,960 | 70.38 | |
| Democratic | Daniel A Duncan | 3,728 | 29.29 | |
| Write-in | 42 | 0.33 | ||
| Total votes | 12,730 | 100.0 | ||
| Republican hold | ||||
District 15
| Party | Candidate | Votes | % | |
|---|---|---|---|---|
| Democratic | J.A. Moore (incumbent) | 4,326 | 56.83 | |
| Republican | Latrecia Pond | 3,276 | 43.04 | |
| Write-in | 10 | 0.13 | ||
| Total votes | 7,612 | 100.0 | ||
| Democratic hold | ||||
District 16
| Party | Candidate | Votes | % | |
|---|---|---|---|---|
| Republican | Mark N Willis (incumbent) | 11,081 | 98.02 | |
| Write-in | 224 | 1.98 | ||
| Total votes | 11,305 | 100.0 | ||
| Republican hold | ||||
District 17
| Party | Candidate | Votes | % | |
|---|---|---|---|---|
| Republican | Mike Burns (incumbent) | 14,127 | 98.37 | |
| Write-in | 234 | 1.63 | ||
| Total votes | 14,361 | 100.0 | ||
| Republican hold | ||||
District 18
| Party | Candidate | Votes | % | |
|---|---|---|---|---|
| Republican | Alan Morgan | 11,431 | 76.53 | |
| Democratic | Michael Reitz | 3,462 | 23.18 | |
| Write-in | 44 | 0.29 | ||
| Total votes | 14,937 | 100.0 | ||
| Republican hold | ||||
District 19
| Party | Candidate | Votes | % | |
|---|---|---|---|---|
| Republican | Patrick B Haddon (incumbent) | 7,851 | 96.82 | |
| Write-in | 258 | 3.18 | ||
| Total votes | 8,109 | 100.0 | ||
| Republican hold | ||||
District 20
| Party | Candidate | Votes | % | |
|---|---|---|---|---|
| Republican | Adam Morgan (incumbent) | 11,358 | 97.78 | |
| Write-in | 258 | 2.22 | ||
| Total votes | 11,616 | 100.0 | ||
| Republican hold | ||||
District 21
| Party | Candidate | Votes | % | |
|---|---|---|---|---|
| Republican | Bobby Cox (incumbent) | 13,109 | 97.80 | |
| Write-in | 295 | 2.20 | ||
| Total votes | 13,404 | 100.0 | ||
| Republican hold | ||||
District 22
| Party | Candidate | Votes | % | |
|---|---|---|---|---|
| Republican | Jason Elliott (incumbent) | 12,006 | 96.33 | |
| Write-in | 457 | 3.67 | ||
| Total votes | 12,463 | 100.0 | ||
| Republican hold | ||||
District 23
| Party | Candidate | Votes | % | |
|---|---|---|---|---|
| Democratic | Chandra Dillard (incumbent) | 6,054 | 97.16 | |
| Write-in | 177 | 2.84 | ||
| Total votes | 6,231 | 100.0 | ||
| Democratic hold | ||||
District 24
| Party | Candidate | Votes | % | |
|---|---|---|---|---|
| Republican | Bruce W Bannister (incumbent) | 12,049 | 96.77 | |
| Write-in | 402 | 3.23 | ||
| Total votes | 12,451 | 100.0 | ||
| Republican hold | ||||
District 25
| Party | Candidate | Votes | % | |
|---|---|---|---|---|
| Democratic | Wendell Jones | 5,558 | 61.73 | |
| Republican | Yvonne Julian | 3,040 | 33.76 | |
| Independent | Tony Boyce | 391 | 4.34 | |
| Write-in | 15 | 0.17 | ||
| Total votes | 9,004 | 100.0 | ||
| Democratic hold | ||||
District 26
| Party | Candidate | Votes | % | |
|---|---|---|---|---|
| Republican | Raye Felder (incumbent) | 9,354 | 63.32 | |
| Democratic | Matt Vilardebo | 5,407 | 36.60 | |
| Write-in | 11 | 0.07 | ||
| Total votes | 14,772 | 100.0 | ||
| Republican hold | ||||
District 27
| Party | Candidate | Votes | % | |
|---|---|---|---|---|
| Republican | David Vaughan | 10,890 | 97.40 | |
| Write-in | 291 | 2.60 | ||
| Total votes | 11,181 | 100.0 | ||
| Republican hold | ||||
District 28
| Party | Candidate | Votes | % | |
|---|---|---|---|---|
| Republican | Ashley Trantham (incumbent) | 10,162 | 67.80 | |
| Democratic | Fritz | 4,804 | 32.05 | |
| Write-in | 22 | 0.15 | ||
| Total votes | 14,988 | 100.0 | ||
| Republican hold | ||||
District 29
| Party | Candidate | Votes | % | |
|---|---|---|---|---|
| Republican | Dennis Moss (incumbent) | 10,668 | 98.92 | |
| Write-in | 117 | 1.08 | ||
| Total votes | 10,785 | 100.0 | ||
| Republican hold | ||||
District 30
| Party | Candidate | Votes | % | |
|---|---|---|---|---|
| Republican | Brian Lawson | 9,971 | 99.10 | |
| Write-in | 91 | 0.90 | ||
| Total votes | 10,062 | 100.0 | ||
| Republican hold | ||||
District 31
| Party | Candidate | Votes | % | |
|---|---|---|---|---|
| Democratic | Rosalyn Henderson-Myers (incumbent) | 5,536 | 97.90 | |
| Write-in | 119 | 2.10 | ||
| Total votes | 5,655 | 100.0 | ||
| Democratic hold | ||||
District 32
| Party | Candidate | Votes | % | |
|---|---|---|---|---|
| Republican | Max Hyde (incumbent) | 8,682 | 96.93 | |
| Write-in | 275 | 3.07 | ||
| Total votes | 8,957 | 100.0 | ||
| Republican hold | ||||
District 33
| Party | Candidate | Votes | % | |
|---|---|---|---|---|
| Republican | Travis A Moore (incumbent) | 11,203 | 98.44 | |
| Write-in | 177 | 1.56 | ||
| Total votes | 11,380 | 100.0 | ||
| Republican hold | ||||
District 34
| Party | Candidate | Votes | % | |
|---|---|---|---|---|
| Republican | Roger A Nut t(incumbent) | 10,732 | 98.03 | |
| Write-in | 216 | 1.97 | ||
| Total votes | 10,948 | 100.0 | ||
| Republican hold | ||||
District 35
| Party | Candidate | Votes | % | |
|---|---|---|---|---|
| Republican | Bill Chumley (incumbent) | 12,269 | 98.01 | |
| Write-in | 249 | 1.99 | ||
| Total votes | 12,518 | 100.0 | ||
| Republican hold | ||||
District 36
| Party | Candidate | Votes | % | |
|---|---|---|---|---|
| Republican | Rob Harris | 8,607 | 97.97 | |
| Write-in | 178 | 2.03 | ||
| Total votes | 8,785 | 100.0 | ||
| Republican hold | ||||
District 37
| Party | Candidate | Votes | % | |
|---|---|---|---|---|
| Republican | Steven W Long (incumbent) | 9,379 | 97.84 | |
| Write-in | 207 | 2.16 | ||
| Total votes | 9,586 | 100.0 | ||
| Republican hold | ||||
District 38
| Party | Candidate | Votes | % | |
|---|---|---|---|---|
| Republican | Josiah Magnuson (incumbent) | 12,875 | 98.36 | |
| Write-in | 215 | 1.64 | ||
| Total votes | 13,090 | 100.0 | ||
| Republican hold | ||||
District 39
| Party | Candidate | Votes | % | |
|---|---|---|---|---|
| Republican | Cal Forrest (incumbent) | 12,385 | 99.06 | |
| Write-in | 118 | 0.94 | ||
| Total votes | 12,503 | 100.0 | ||
| Republican hold | ||||
District 40
| Party | Candidate | Votes | % | |
|---|---|---|---|---|
| Republican | Joe White | 10,821 | 98.16 | |
| Write-in | 203 | 1.84 | ||
| Total votes | 11,024 | 100.0 | ||
| Republican hold | ||||
District 41
| Party | Candidate | Votes | % | |
|---|---|---|---|---|
| Democratic | Annie E McDaniel (incumbent) | 8,075 | 57.28 | |
| Republican | Jennifer Brecheisen | 6,005 | 42.59 | |
| Write-in | 18 | 0.13 | ||
| Total votes | 14,098 | 100.0 | ||
| Democratic hold | ||||
District 42
| Party | Candidate | Votes | % | |
|---|---|---|---|---|
| Republican | Doug Gilliam (incumbent) | 8,905 | 94.57 | |
| Write-in | 511 | 5.43 | ||
| Total votes | 9,416 | 100.0 | ||
| Republican hold | ||||
District 43
| Party | Candidate | Votes | % | |
|---|---|---|---|---|
| Republican | Randy Ligon(incumbent) | 10,334 | 98.64 | |
| Write-in | 142 | 1.36 | ||
| Total votes | 10,476 | 100.0 | ||
| Republican hold | ||||
District 44
| Party | Candidate | Votes | % | |
|---|---|---|---|---|
| Republican | Mike Neese | 11,725 | 62.71 | |
| Democratic | Katie Crosby | 6,647 | 35.55 | |
| Independent | Aaron McKinney | 306 | 1.64 | |
| Write-in | 20 | 0.11 | ||
| Total votes | 18,698 | 100.0 | ||
| Republican hold | ||||
District 45
| Party | Candidate | Votes | % | |
|---|---|---|---|---|
| Republican | Brandon Newton (incumbent) | 8,124 | 67.26 | |
| Democratic | Keith T Grey Sr | 3,939 | 32.61 | |
| Write-in | 16 | 0.13 | ||
| Total votes | 12,079 | 100.0 | ||
| Republican hold | ||||
District 46
| Party | Candidate | Votes | % | |
|---|---|---|---|---|
| Republican | Heath Sessions | 10,373 | 97.55 | |
| Write-in | 261 | 2.45 | ||
| Total votes | 10,634 | 100.0 | ||
| Republican hold | ||||
District 47
| Party | Candidate | Votes | % | |
|---|---|---|---|---|
| Republican | Tommy Pope (incumbent) | 12,501 | 98.54 | |
| Write-in | 185 | 1.46 | ||
| Total votes | 12,686 | 100.0 | ||
| Republican hold | ||||
District 48
| Party | Candidate | Votes | % | |
|---|---|---|---|---|
| Republican | Brandon Guffey | 10,938 | 67.35 | |
| Democratic | Andrew Russell | 5,279 | 32.50 | |
| Write-in | 24 | 0.15 | ||
| Total votes | 16,241 | 100.0 | ||
| Republican hold | ||||
District 49
| Party | Candidate | Votes | % | |
|---|---|---|---|---|
| Democratic | John R King (incumbent) | 6,346 | 64.84 | |
| Republican | Thomas Hardin | 3,436 | 35.11 | |
| Write-in | 5 | 0.05 | ||
| Total votes | 9,787 | 100.0 | ||
| Democratic hold | ||||
District 50
| Party | Candidate | Votes | % | |
|---|---|---|---|---|
| Democratic | Mike Neese | 7,815 | 59.98 | |
| Republican | Katie Crosby | 5,201 | 39.92 | |
| Write-in | 13 | 0.10 | ||
| Total votes | 13,029 | 100.0 | ||
| Democratic hold | ||||
District 51
| Party | Candidate | Votes | % | |
|---|---|---|---|---|
| Democratic | David Weeks (incumbent) | 7,895 | 98.42 | |
| Write-in | 127 | 1.58 | ||
| Total votes | 8,022 | 100.0 | ||
| Democratic hold | ||||
District 52
| Party | Candidate | Votes | % | |
|---|---|---|---|---|
| Republican | Ben Connell | 9,356 | 64.79 | |
| Democratic | Eve Carlin | 5,036 | 34.88 | |
| Write-in | 48 | 0.33 | ||
| Total votes | 14,440 | 100.0 | ||
| Republican hold | ||||
District 53
| Party | Candidate | Votes | % | |
|---|---|---|---|---|
| Republican | Richard L Richie Yow (incumbent) | 9,777 | 99.32 | |
| Write-in | 67 | 0.68 | ||
| Total votes | 11,249 | 100.0 | ||
| Republican hold | ||||
District 54
| Party | Candidate | Votes | % | |
|---|---|---|---|---|
| Democratic | Patricia Moore Pat Henegan (incumbent) | 5,804 | 52.30 | |
| Republican | Sterling McDiarmid | 5,287 | 47.64 | |
| Write-in | 7 | 0.06 | ||
| Total votes | 11,098 | 100.0 | ||
| Democratic hold | ||||
District 55
| Party | Candidate | Votes | % | |
|---|---|---|---|---|
| Democratic | Jackie E Hayes (incumbent) | 5,577 | 49.85 | |
| Republican | Robert Norton | 5,208 | 46.55 | |
| Independent | Michael Copland | 383 | 3.42 | |
| Write-in | 20 | 0.18 | ||
| Total votes | 11,188 | 100.0 | ||
| Democratic hold | ||||
District 56
| Party | Candidate | Votes | % | |
|---|---|---|---|---|
| Republican | Tim McGinnis (incumbent) | 13,242 | 98.81 | |
| Write-in | 159 | 1.19 | ||
| Total votes | 13,401 | 100.0 | ||
| Republican hold | ||||
District 57
| Party | Candidate | Votes | % | |
|---|---|---|---|---|
| Democratic | Lucas Atkinson (incumbent) | 8,500 | 98.53 | |
| Write-in | 127 | 1.47 | ||
| Total votes | 8,627 | 100.0 | ||
| Democratic hold | ||||
District 58
| Party | Candidate | Votes | % | |
|---|---|---|---|---|
| Republican | Jeff Johnson (incumbent) | 10,115 | 98.97 | |
| Write-in | 105 | 1.03 | ||
| Total votes | 10,220 | 100.0 | ||
| Republican hold | ||||
District 59
| Party | Candidate | Votes | % | |
|---|---|---|---|---|
| Democratic | Terry Alexander (incumbent) | 7,483 | 97.96 | |
| Write-in | 156 | 2.04 | ||
| Total votes | 7,639 | 100.0 | ||
| Democratic hold | ||||
District 60
| Party | Candidate | Votes | % | |
|---|---|---|---|---|
| Republican | Phillip Lowe (incumbent) | 9,550 | 98.51 | |
| Write-in | 144 | 1.49 | ||
| Total votes | 9,694 | 100.0 | ||
| Republican hold | ||||
District 61
| Party | Candidate | Votes | % | |
|---|---|---|---|---|
| Republican | Carla Schuessler | 8,365 | 69.23 | |
| Democratic | Ashlyn Preaux | 3,703 | 30.65 | |
| Write-in | 15 | 0.12 | ||
| Total votes | 12,083 | 100.0 | ||
| Republican gain from Democratic | ||||
District 62
| Party | Candidate | Votes | % | |
|---|---|---|---|---|
| Democratic | Robert Williams (incumbent) | 6,974 | 96.74 | |
| Write-in | 235 | 3.26 | ||
| Total votes | 7,209 | 100.0 | ||
| Democratic hold | ||||
District 63
| Party | Candidate | Votes | % | |
|---|---|---|---|---|
| Republican | Jay Jordan (incumbent) | 9,432 | 68.73 | |
| Democratic | Vincent Coe | 4,276 | 31.16 | |
| Write-in | 16 | 0.12 | ||
| Total votes | 13,724 | 100.0 | ||
| Republican hold | ||||
District 64
| Party | Candidate | Votes | % | |
|---|---|---|---|---|
| Republican | Fawn Pedalino | 7,796 | 55.19 | |
| Democratic | Kimberly O Johnson (incumbent) | 6,315 | 44.71 | |
| Write-in | 14 | 0.10 | ||
| Total votes | 14,125 | 100.0 | ||
| Republican gain from Democratic | ||||
District 65
| Party | Candidate | Votes | % | |
|---|---|---|---|---|
| Republican | Cody T Mitchell | 10,760 | 98.94 | |
| Write-in | 115 | 1.06 | ||
| Total votes | 10,875 | 100.0 | ||
| Republican hold | ||||
District 66
| Party | Candidate | Votes | % | |
|---|---|---|---|---|
| Republican | David L O'Neal | 8,615 | 57.72 | |
| Democratic | Carla Litrenta | 6,297 | 42.19 | |
| Write-in | 13 | 0.09 | ||
| Total votes | 14,925 | 100.0 | ||
| Republican gain from Democratic | ||||
District 67
| Party | Candidate | Votes | % | |
|---|---|---|---|---|
| Republican | Murrell Smith (incumbent) | 9,705 | 98.43 | |
| Write-in | 155 | 1.57 | ||
| Total votes | 9,860 | 100.0 | ||
| Republican hold | ||||
District 68
| Party | Candidate | Votes | % | |
|---|---|---|---|---|
| Republican | Heather Ammons Crawford (incumbent) | 10,910 | 71.95 | |
| Democratic | Ernest Carson | 4,243 | 27.98 | |
| Write-in | 11 | 0.07 | ||
| Total votes | 15,164 | 100.0 | ||
| Republican hold | ||||
District 69
| Party | Candidate | Votes | % | |
|---|---|---|---|---|
| Republican | Chris Wooten (incumbent) | 11,836 | 97.69 | |
| Write-in | 280 | 2.31 | ||
| Total votes | 12,116 | 100.0 | ||
| Republican hold | ||||
District 70
| Party | Candidate | Votes | % | |
|---|---|---|---|---|
| Democratic | Jermaine Johnson | 10,052 | 76.45 | |
| Republican | Vincent E Wilson | 2,623 | 19.95 | |
| Green | Charla Henson-Simons | 456 | 3.47 | |
| Write-in | 18 | 0.14 | ||
| Total votes | 13,149 | 100.0 | ||
| Democratic hold | ||||
District 71
| Party | Candidate | Votes | % | |
|---|---|---|---|---|
| Republican | Nathan Ballentine (incumbent) | 13,712 | 97.78 | |
| Write-in | 311 | 2.22 | ||
| Total votes | 14,023 | 100.0 | ||
| Republican hold | ||||
District 72
| Party | Candidate | Votes | % | |
|---|---|---|---|---|
| Democratic | Seth Rose (incumbent) | 5,730 | 98.49 | |
| Write-in | 88 | 1.51 | ||
| Total votes | 5,818 | 100.0 | ||
| Democratic hold | ||||
District 73
| Party | Candidate | Votes | % | |
|---|---|---|---|---|
| Democratic | Chris Hart (incumbent) | 8,305 | 98.58 | |
| Write-in | 120 | 1.42 | ||
| Total votes | 8,425 | 100.0 | ||
| Democratic hold | ||||
District 74
| Party | Candidate | Votes | % | |
|---|---|---|---|---|
| Democratic | Todd Rutherford (incumbent) | 9,089 | 98.60 | |
| Write-in | 129 | 1.40 | ||
| Total votes | 9,218 | 100.0 | ||
| Democratic hold | ||||
District 75
| |||||||||||||||||
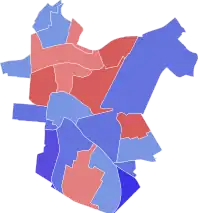 Precinct results Bauer: 50–60% 60–70% 70–80% 80–90% Finlay III: 50–60% 60–70% | |||||||||||||||||
| |||||||||||||||||
The 75th district, which is nestled in the heart of Richland County, contains some of Columbia's more affluent neighborhoods, including Forest Acres, Shandon, and Rosewood.[12] The incumbent was Republican Kirkman Finlay III, who was re-elected with 50.7% of the vote in 2020.[13]
Nominee
- Kirkman Finlay III, incumbent state representative[12]
Nominee
- Heather Bauer, entrepreneur and candidate for this district in 2020[12]
Predictions
| Source | Ranking | As of |
|---|---|---|
| CNalysis[9] | Likely R | November 7, 2022 |
Endorsements
State officials
- Leon Howard, state representative for the 76th district (1995–present) (Democratic)[14]
Local officials
- Leon Lott, sheriff of Richland County (1997–present) and commander of the South Carolina State Guard (2018–present) (Democratic)[14]
Organizations
- Emerge America[15]
- Everytown for Gun Safety[15]
- Planned Parenthood[15]
- Progressive Turnout Project[15]
- Run for Something[15]
- Working Families[15]
Fundraising
| Campaign finance reports as of December 31, 2022 | |||
|---|---|---|---|
| Candidate (party) | Total receipts | Total disbursements | Cash on hand |
| Kirkman Finlay III (R) | $340,078 | $326,928 | $5,614 |
| Heather Bauer (D) | $65,968 | $64,534 | $1,434 |
| Source: South Carolina Ethics Commission[16][17] | |||
Results
| Party | Candidate | Votes | % | |
|---|---|---|---|---|
| Democratic | Heather Bauer | 7,505 | 50.74 | |
| Republican | Kirkman Finlay III (incumbent) | 7,270 | 49.15 | |
| Write-in | 17 | 0.11 | ||
| Total votes | 14,792 | 100.0 | ||
| Democratic gain from Republican | ||||
District 76
| Party | Candidate | Votes | % | |
|---|---|---|---|---|
| Democratic | Leon Howard (incumbent) | 9,186 | 99.04 | |
| Write-in | 89 | 0.96 | ||
| Total votes | 9,275 | 100.0 | ||
| Democratic hold | ||||
District 77
| Party | Candidate | Votes | % | |
|---|---|---|---|---|
| Democratic | Kambrell Garvin (incumbent) | 10,183 | 70.88 | |
| Republican | Kizzie Smalls | 4,179 | 29.09 | |
| Write-in | 5 | 0.03 | ||
| Total votes | 14,367 | 100.0 | ||
| Democratic hold | ||||
District 78
| Party | Candidate | Votes | % | |
|---|---|---|---|---|
| Democratic | Beth Bernstein (incumbent) | 9,770 | 97.91 | |
| Write-in | 209 | 2.09 | ||
| Total votes | 9,979 | 100.0 | ||
| Democratic hold | ||||
District 79
| Party | Candidate | Votes | % | |
|---|---|---|---|---|
| Democratic | Ivory T Thigpen (incumbent) | 10,105 | 74.53 | |
| Republican | Melissa McFadden | 3,440 | 25.37 | |
| Write-in | 13 | 0.10 | ||
| Total votes | 13,558 | 100.0 | ||
| Democratic hold | ||||
District 80
| Party | Candidate | Votes | % | |
|---|---|---|---|---|
| Republican | Kathy Landing | 11,766 | 62.88 | |
| Democratic | Donna Brown Newton | 6,926 | 37.01 | |
| Write-in | 20 | 0.11 | ||
| Total votes | 18,712 | 100.0 | ||
| Republican gain from Democratic | ||||
District 81
| Party | Candidate | Votes | % | |
|---|---|---|---|---|
| Republican | Bart T Blackwell (incumbent) | 13,180 | 97.41 | |
| Write-in | 351 | 2.59 | ||
| Total votes | 13,531 | 100.0 | ||
| Republican hold | ||||
District 82
| Party | Candidate | Votes | % | |
|---|---|---|---|---|
| Democratic | William Bill Clyburn (incumbent) | 6,510 | 94.03 | |
| Write-in | 413 | 5.97 | ||
| Total votes | 6,923 | 100.0 | ||
| Democratic hold | ||||
District 83
| Party | Candidate | Votes | % | |
|---|---|---|---|---|
| Republican | Bill Hixon (incumbent) | 10,430 | 75.94 | |
| Democratic | Jerico McCoy | 3,287 | 23.93 | |
| Write-in | 17 | 0.12 | ||
| Total votes | 11,188 | 100.0 | ||
| Republican hold | ||||
District 84
| Party | Candidate | Votes | % | |
|---|---|---|---|---|
| Republican | Melissa Oremus (incumbent) | 8,934 | 97.92 | |
| Write-in | 190 | 2.08 | ||
| Total votes | 9,124 | 100.0 | ||
| Republican hold | ||||
District 85
| Party | Candidate | Votes | % | |
|---|---|---|---|---|
| Republican | Jay Kilmartin | 11,450 | 75.53 | |
| Libertarian | John Davis | 3,611 | 23.82 | |
| Write-in | 99 | 0.65 | ||
| Total votes | 15,160 | 100.0 | ||
| Republican hold | ||||
District 86
| Party | Candidate | Votes | % | |
|---|---|---|---|---|
| Republican | Bill Taylor (incumbent) | 9,727 | 98.30 | |
| Write-in | 168 | 1.70 | ||
| Total votes | 9,895 | 100.0 | ||
| Republican hold | ||||
District 87
| Party | Candidate | Votes | % | |
|---|---|---|---|---|
| Republican | Paula Rawl Calhoon (incumbent) | 14,153 | 98.48 | |
| Write-in | 219 | 1.52 | ||
| Total votes | 14,372 | 100.0 | ||
| Republican hold | ||||
District 88
| Party | Candidate | Votes | % | |
|---|---|---|---|---|
| Republican | RJ May (incumbent) | 8,304 | 70.09 | |
| Democratic | Daniel J Shrief | 3,531 | 29.81 | |
| Write-in | 12 | 0.10 | ||
| Total votes | 11,847 | 100.0 | ||
| Republican hold | ||||
District 89
| Party | Candidate | Votes | % | |
|---|---|---|---|---|
| Republican | Micah Caskey (incumbent) | 8,760 | 96.84 | |
| Write-in | 286 | 3.16 | ||
| Total votes | 9,046 | 100.0 | ||
| Republican hold | ||||
District 90
| Party | Candidate | Votes | % | |
|---|---|---|---|---|
| Democratic | Justin Bamberg (incumbent) | 6,845 | 58.72 | |
| Republican | Robert Norton | 4,805 | 41.22 | |
| Write-in | 8 | 0.07 | ||
| Total votes | 11,658 | 100.0 | ||
| Democratic hold | ||||
District 91
| Party | Candidate | Votes | % | |
|---|---|---|---|---|
| Democratic | Loonie Hosey (incumbent) | 7,560 | 97.15 | |
| Write-in | 222 | 2.85 | ||
| Total votes | 7,782 | 100.0 | ||
| Democratic hold | ||||
District 92
| Party | Candidate | Votes | % | |
|---|---|---|---|---|
| Republican | Brandon Cox | 9,283 | 97.79 | |
| Write-in | 210 | 2.21 | ||
| Total votes | 9,493 | 100.0 | ||
| Republican hold | ||||
District 93
| Party | Candidate | Votes | % | |
|---|---|---|---|---|
| Democratic | Russell L Ott (incumbent) | 8,139 | 60.77 | |
| Republican | Jim Ulmer | 5,238 | 39.11 | |
| Write-in | 16 | 0.12 | ||
| Total votes | 13,393 | 100.0 | ||
| Democratic hold | ||||
District 94
| Party | Candidate | Votes | % | |
|---|---|---|---|---|
| Republican | Gil Gatch (incumbent) | 8,363 | 63.26 | |
| Democratic | Ilene Davis | 4,837 | 36.59 | |
| Write-in | 19 | 0.14 | ||
| Total votes | 13,219 | 100.0 | ||
| Republican hold | ||||
District 95
| Party | Candidate | Votes | % | |
|---|---|---|---|---|
| Democratic | Gilda Cobb-Hunter | 8,033 | 59.11 | |
| Republican | Jeffrey Cila | 5,545 | 40.81 | |
| Write-in | 11 | 0.08 | ||
| Total votes | 13,589 | 100.0 | ||
| Democratic hold | ||||
District 96
| Party | Candidate | Votes | % | |
|---|---|---|---|---|
| Republican | D Ryan McCabe (incumbent) | 8,323 | 98.32 | |
| Write-in | 142 | 1.68 | ||
| Total votes | 8,465 | 100.0 | ||
| Republican hold | ||||
District 97
| Party | Candidate | Votes | % | |
|---|---|---|---|---|
| Republican | Robby Robbins | 9,140 | 68.08 | |
| Democratic | ReZsaun Lewis | 4,274 | 31.83 | |
| Write-in | 12 | 0.09 | ||
| Total votes | 13,426 | 100.0 | ||
| Republican hold | ||||
District 98
| Party | Candidate | Votes | % | |
|---|---|---|---|---|
| Republican | Christopher J Murphy (incumbent) | 6,770 | 57.82 | |
| Democratic | Sydney Clinton | 4,925 | 42.06 | |
| Write-in | 14 | 0.12 | ||
| Total votes | 11,709 | 100.0 | ||
| Republican hold | ||||
District 99
| Party | Candidate | Votes | % | |
|---|---|---|---|---|
| Republican | Marvin Mark Smith (incumbent) | 11,104 | 98.23 | |
| Write-in | 200 | 1.77 | ||
| Total votes | 11,304 | 100.0 | ||
| Republican hold | ||||
District 100
| Party | Candidate | Votes | % | |
|---|---|---|---|---|
| Republican | Sylleste Davis (incumbent) | 9,639 | 98.34 | |
| Write-in | 163 | 1.66 | ||
| Total votes | 9,802 | 100.0 | ||
| Republican hold | ||||
District 101
| Party | Candidate | Votes | % | |
|---|---|---|---|---|
| Democratic | Roger K Kirby | 8,662 | 97.49 | |
| Write-in | 223 | 2.51 | ||
| Total votes | 8,885 | 100.0 | ||
| Democratic hold | ||||
District 102
The 102nd district takes in parts of Berkeley and Dorchester counties; its share of Dorchester includes a portion of Summerville, the county's second-most populous municipality. The incumbent was Democrat Joe Jefferson, who was re-elected unopposed in 2020.[18]
Nominee
- Joe Jefferson, incumbent state representative[19]
Eliminated in primary
- Collin Holloway[20]
Results
| Party | Candidate | Votes | % | |
|---|---|---|---|---|
| Democratic | Joe Jefferson (incumbent) | 1,805 | 84.58 | |
| Democratic | Collin Holloway | 329 | 15.42 | |
| Total votes | 2,134 | 100.0 | ||
Nominee
- Ralph Elsey[19]
Predictions
| Source | Ranking | As of |
|---|---|---|
| CNalysis[9] | Tilt D | November 7, 2022 |
Endorsements
Organizations
- Conservation Voters of South Carolina[21]
- Planned Parenthood[21]
- Progressive Turnout Project[21]
Fundraising
| Campaign finance reports as of December 31, 2022 | |||
|---|---|---|---|
| Candidate (party) | Total receipts | Total disbursements | Cash on hand |
| Joe Jefferson (D) | $14,694 | $15,472 | $10,941 |
| Ralph Elsey (R) | $6,172 | $6,512 | $97 |
| Source: South Carolina Ethics Commission[22][23] | |||
Results
| Party | Candidate | Votes | % | |
|---|---|---|---|---|
| Democratic | Joe Jefferson (incumbent) | 6,353 | 51.08 | |
| Republican | Ralph Elsey | 6,075 | 48.84 | |
| Write-in | 10 | 0.08 | ||
| Total votes | 12,438 | 100.0 | ||
| Democratic hold | ||||
District 103
| Party | Candidate | Votes | % | |
|---|---|---|---|---|
| Democratic | Carl Anderson (incumbent) | 7,458 | 97.30 | |
| Write-in | 207 | 2.70 | ||
| Total votes | 7,665 | 100.0 | ||
| Democratic hold | ||||
District 104
| Party | Candidate | Votes | % | |
|---|---|---|---|---|
| Republican | William Bailey (incumbent) | 16,810 | 99.17 | |
| Write-in | 140 | 0.83 | ||
| Total votes | 16,950 | 100.0 | ||
| Republican hold | ||||
District 105
| Party | Candidate | Votes | % | |
|---|---|---|---|---|
| Republican | Kevin Hardee (incumbent) | 12,110 | 99.10 | |
| Write-in | 110 | 0.90 | ||
| Total votes | 12,220 | 100.0 | ||
| Republican hold | ||||
District 106
| Party | Candidate | Votes | % | |
|---|---|---|---|---|
| Republican | Val Guest | 14,675 | 72.70 | |
| Democratic | Ryan Thompson | 5,508 | 27.29 | |
| Write-in | 4 | 0.02 | ||
| Total votes | 20,187 | 100.0 | ||
| Republican hold | ||||
District 107
| Party | Candidate | Votes | % | |
|---|---|---|---|---|
| Republican | Case Brittain (incumbent) | 11,742 | 98.51 | |
| Write-in | 177 | 1.49 | ||
| Total votes | 11,919 | 100.0 | ||
| Republican hold | ||||
District 108
| Party | Candidate | Votes | % | |
|---|---|---|---|---|
| Republican | Lee Hewitt (incumbent) | 15,847 | 98.91 | |
| Write-in | 175 | 1.09 | ||
| Total votes | 16,022 | 100.0 | ||
| Republican hold | ||||
District 109
| Party | Candidate | Votes | % | |
|---|---|---|---|---|
| Democratic | Deon Tedder (incumbent) | 5,912 | 76.44 | |
| Libertarian | Rodney Travis | 1,764 | 22.81 | |
| Write-in | 58 | 0.75 | ||
| Total votes | 7,734 | 100.0 | ||
| Democratic hold | ||||
District 110
| Party | Candidate | Votes | % | |
|---|---|---|---|---|
| Republican | Tom Hartnett | 9,729 | 54.12 | |
| Democratic | Ellis Roberts | 8,243 | 45.85 | |
| Write-in | 5 | 0.03 | ||
| Total votes | 17,977 | 100.0 | ||
| Republican hold | ||||
District 111
| Party | Candidate | Votes | % | |
|---|---|---|---|---|
| Democratic | Wendell Gilliard (incumbent) | 9,541 | 98.21 | |
| Write-in | 174 | 1.79 | ||
| Total votes | 9,715 | 100.0 | ||
| Democratic hold | ||||
District 112
| Party | Candidate | Votes | % | |
|---|---|---|---|---|
| Republican | Joe Bustos (incumbent) | 12,007 | 59.10 | |
| Democratic | David Stanley Artushin | 8,267 | 40.69 | |
| Write-in | 41 | 0.20 | ||
| Total votes | 20,315 | 100.0 | ||
| Republican hold | ||||
District 113
| Party | Candidate | Votes | % | |
|---|---|---|---|---|
| Democratic | Marvin R. Pendarvis (incumbent) | 6,056 | 98.14 | |
| Write-in | 115 | 1.86 | ||
| Total votes | 6,171 | 100.0 | ||
| Democratic hold | ||||
District 114
| Party | Candidate | Votes | % | |
|---|---|---|---|---|
| Republican | Gary Brewer | 9,683 | 58.87 | |
| Democratic | Michelle Brandt | 6,760 | 41.10 | |
| Write-in | 6 | 0.04 | ||
| Total votes | 16,449 | 100.0 | ||
| Republican hold | ||||
District 115
| Party | Candidate | Votes | % | |
|---|---|---|---|---|
| Democratic | Spencer Wetmore (incumbent) | 10,734 | 53.77 | |
| Republican | Carroll O'Neal | 9,215 | 46.16 | |
| Write-in | 14 | 0.07 | ||
| Total votes | 19,963 | 100.0 | ||
| Democratic hold | ||||
District 116
| Party | Candidate | Votes | % | |
|---|---|---|---|---|
| Republican | Matt Leber | 8,774 | 51.67 | |
| Democratic | Chardale Murray (incumbent) | 8,193 | 48.25 | |
| Write-in | 13 | 0.08 | ||
| Total votes | 16,980 | 100.0 | ||
| Republican gain from Democratic | ||||
District 117
| Party | Candidate | Votes | % | |
|---|---|---|---|---|
| Republican | Jordan Pace | 8,515 | 63.55 | |
| Democratic | Krystle Matthews (incumbent) | 4,874 | 36.38 | |
| Write-in | 10 | 0.07 | ||
| Total votes | 13,399 | 100.0 | ||
| Republican gain from Democratic | ||||
District 118
| Party | Candidate | Votes | % | |
|---|---|---|---|---|
| Republican | Bill Herbkersman (incumbent) | 12,584 | 96.58 | |
| Write-in | 445 | 3.42 | ||
| Total votes | 13,029 | 100.0 | ||
| Republican hold | ||||
District 119
| Party | Candidate | Votes | % | |
|---|---|---|---|---|
| Democratic | Leon Stavrinakis (incumbent) | 10,299 | 57.47 | |
| Republican | Ken Fipps | 7,609 | 42.46 | |
| Write-in | 13 | 0.07 | ||
| Total votes | 17,921 | 100.0 | ||
| Democratic hold | ||||
District 120
| Party | Candidate | Votes | % | |
|---|---|---|---|---|
| Republican | Weston Newton (incumbent) | 13,427 | 98.62 | |
| Write-in | 188 | 1.38 | ||
| Total votes | 13,615 | 100.0 | ||
| Republican hold | ||||
District 121
| Party | Candidate | Votes | % | |
|---|---|---|---|---|
| Democratic | Michael F. Rivers Sr. (incumbent) | 6,523 | 57.33 | |
| Republican | Eric J Erickson | 4,848 | 42.61 | |
| Write-in | 6 | 0.05 | ||
| Total votes | 11,377 | 100.0 | ||
| Democratic hold | ||||
District 122
| Party | Candidate | Votes | % | |
|---|---|---|---|---|
| Republican | Bill Hager | 7,345 | 53.96 | |
| Democratic | Shedron D. Williams (incumbent) | 6,259 | 45.98 | |
| Write-in | 7 | 0.05 | ||
| Total votes | 13,611 | 100.0 | ||
| Republican gain from Democratic | ||||
District 123
| Party | Candidate | Votes | % | |
|---|---|---|---|---|
| Republican | Jeff Bradley (incumbent) | 13,455 | 92.38 | |
| Write-in | 1,110 | 7.62 | ||
| Total votes | 14,565 | 100.0 | ||
| Republican hold | ||||
District 124
| Party | Candidate | Votes | % | |
|---|---|---|---|---|
| Republican | Shannon Erickson (incumbent) | 9,180 | 62.77 | |
| Democratic | Barb Nash | 5,432 | 37.14 | |
| Write-in | 13 | 0.09 | ||
| Total votes | 14,625 | 100.0 | ||
| Republican hold | ||||
See also
- 2022 South Carolina elections
References
- Pollard, James (November 12, 2022). "South Carolina gives GOP a ruby-red bright spot in midterms". AP News. Associated Press. Retrieved November 13, 2022.
- Vernon, Sara (November 11, 2022). "South Carolina 2022 Midterm Election Review". JD Supra. Retrieved November 13, 2022.
- Laird, Skylar (November 9, 2022). "How Republicans won much of Charleston while Columbia ousted GOP incumbent". The Post and Courier. Retrieved November 13, 2022.
- "2022 Statewide General Election". scvotes.gov. South Carolina Election Commission. November 17, 2022. Retrieved March 18, 2023.
- Bohatch, Emily; Bustos, Joseph (March 30, 2022). "At least 13 SC House members are retiring as candidate filing opens for 2022 elections". The State. Retrieved April 14, 2023.
- "Rep Stringer 2nd Republican to leave SC House before session". AP News. Associated Press. January 10, 2022. Retrieved April 14, 2023.
- "2022 Statewide Primaries". scvotes.gov. South Carolina Election Commission. June 20, 2022. Retrieved April 15, 2023.
- Jacobson, Louis (May 19, 2022). "The Battle for State Legislatures". Sabato's Crystal Ball. Retrieved May 19, 2022.
- "SC State Leg. Forecast". CNalysis. November 7, 2022. Retrieved March 17, 2022.
- "House District 97 Special - May 17, 2022". scvotes.gov. South Carolina Election Commission. May 23, 2022. Retrieved March 17, 2023.
- "House District 18 Special - May 24, 2022". scvotes.gov. South Carolina Election Commission. May 27, 2022. Retrieved March 17, 2023.
- "Here's the final vote in the Kirkman Finlay and Heather Bauer State House race". WLTX. November 9, 2022. Retrieved April 13, 2023.
- Monk, John (November 7, 2020). "Republican Finlay narrowly wins Columbia SC House seat after vote count finally ends". The State. Retrieved April 13, 2023.
- Laird, Skylar (November 9, 2022). "Columbia GOP lawmaker Kirkman Finlay loses SC House seat to Democrat Heather Bauer". The Post and Courier. Retrieved April 13, 2023.
- "Heather Bauer's Ratings and Endorsements". Vote Smart. Retrieved April 13, 2023.
- "Quarter 4, 2022 Report | Kirkman Finlay, III". ethicsfiling.sc.gov. South Carolina Ethics Commission. January 12, 2023. Retrieved April 14, 2023.
- "Quarter 4, 2022 Report | Heather R. Bauer". ethicsfiling.sc.gov. South Carolina Ethics Commission. January 20, 2023. Retrieved April 14, 2023.
- Koeske, Zak (November 17, 2022). "GOP picked up most SC House seats since chamber flipped in '94. How'd they do it?". The State. Retrieved April 14, 2023.
- Owens, Raymond (October 7, 2022). "Berkeley County elections: Who is on the ballot". WCBD News 2. Retrieved April 15, 2023.
- Renaud, Tim (June 14, 2022). "Top races we're watching during the South Carolina primary". WCBD News 2. Retrieved April 15, 2023.
- "Joseph Jefferson, Jr.'s Ratings and Endorsements". Vote Smart. Retrieved April 15, 2023.
- "Quarter 4, 2022 Report | Joseph H. Jefferson". ethicsfiling.sc.gov. South Carolina Ethics Commission. January 9, 2023. Retrieved April 15, 2023.
- "Quarter 4, 2022 Report | Ralph M. Elsey". ethicsfiling.sc.gov. South Carolina Ethics Commission. January 9, 2023. Retrieved April 15, 2023.
External links
- Government Documents Round Table of the American Library Association, "South Carolina", Voting & Elections Toolkits
- "South Carolina: Election Tools, Deadlines, Dates, Rules, and Links", Vote.org, Oakland, CA
- "League of Women Voters of South Carolina". (State affiliate of the U.S. League of Women Voters)
- South Carolina at Ballotpedia
- This Week in South Carolina | Midterm Election Recap - South Carolina ETV