2011 Plymouth City Council election
The 2011 Plymouth City Council election took place on 5 May 2011 to elect members to Plymouth City Council in England. One third of the council was up for election, in addition to a by-election, making twenty seats in total. The previous election produced a majority for the Conservative Party. The election resulted in Labour gaining 5 seats with Conservatives retaining control.[2]
| |||||||||||||||||||||||||||||||||||||||||
20 of the 57 seats to Plymouth City Council 29 seats needed for a majority | |||||||||||||||||||||||||||||||||||||||||
|---|---|---|---|---|---|---|---|---|---|---|---|---|---|---|---|---|---|---|---|---|---|---|---|---|---|---|---|---|---|---|---|---|---|---|---|---|---|---|---|---|---|
| |||||||||||||||||||||||||||||||||||||||||
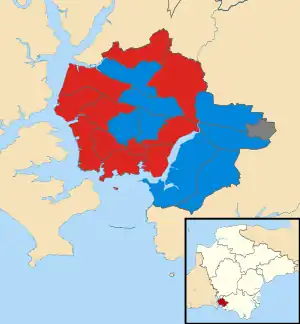 Map showing the results of contested wards in the 2011 Plymouth City Council elections. | |||||||||||||||||||||||||||||||||||||||||
| |||||||||||||||||||||||||||||||||||||||||
Background
Plymouth City Council held local elections on 5 May 2011 as part of the 2011 local elections.[3] The council elects its councillors in thirds, with a third being up for election every year for three years, with no election in the fourth year.[4][5] Councillors defending their seats in this election were previously elected in 2007. In that election, eleven Conservative candidates and eight Labour candidates were elected.[6]
Ahead of this election, the Conservatives had controlled the council for four years, with the main opposition being the Labour Party.
Overall results
| Party | Seats | Gains | Losses | Net gain/loss | Seats % | Votes % | Votes | +/− | |
|---|---|---|---|---|---|---|---|---|---|
| Labour | 12 | 4 | 0 | 60.0 | 40.7 | 28,340 | |||
| Conservative | 8 | 0 | 4 | 40.0 | 40.5 | 28,219 | |||
| Liberal Democrats | 0 | 0 | 0 | 0.0 | 4.3 | 3,017 | |||
| UKIP | 0 | 0 | 0 | 0.0 | 11.7 | 8,176 | |||
| Green | 0 | 0 | 0 | 0.0 | 2.2 | 1,510 | |||
| Independent | 0 | 0 | 0 | 0.0 | 0.5 | 378 | |||
| TUSC | 0 | 0 | 0 | 0.0 | 0.1 | 75 | New | ||
| Total | 20 | 69,715 | |||||||
Note: All changes in vote share are in comparison to the corresponding 2007 election.
The Conservatives maintained their overall majority on the council, though reduced from six seats to two.
After the previous election, the composition of the council was:
| 36 | 20 | 1 |
| Conservative | Labour | Ind |
Immediately before the election, the composition of the council was:
| 36 | 20 | 1 |
| Conservative | Labour | UKIP |
After this election, the composition of the council was:
| 31 | 25 | 1 |
| Conservative | Labour | UKIP |
Ward results
Budshead
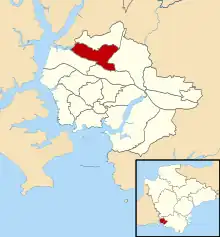
| Party | Candidate | Votes | % | |
|---|---|---|---|---|
| Conservative | Jonathan Charles Thomas Drean | 1,756 | 45.8 | |
| Labour Co-op | Mike Fox | 1,641 | 42.8 | |
| UKIP | Hugh Martyn Williams | 437 | 11.4 | |
| Majority | 115 | 3.0 | ||
| Turnout | 3834 | 40.0 | ||
| Conservative hold | ||||
Compton
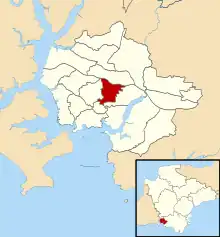
| Party | Candidate | Votes | % | |
|---|---|---|---|---|
| Conservative | David John Stark | 1,938 | 48.3 | |
| Labour | Stephen Paul Randall | 1,086 | 27.0 | |
| UKIP | Michael Robert Cooke | 364 | 9.1 | |
| Liberal Democrats | Paul Huntley | 359 | 8.9 | |
| Green | Colin James Trier | 268 | 6.7 | |
| Majority | 852 | 21.2 | ||
| Turnout | 4,015 | 42.8 | ||
| Conservative hold | ||||
Devonport

| Party | Candidate | Votes | % | |
|---|---|---|---|---|
| Labour | Mark Antony Coker | 1,519 | 52.1 | |
| Conservative | Betty Gray | 830 | 28.5 | |
| UKIP | Syd Brooks | 403 | 13.8 | |
| Green | Andrew Robert Pratt | 162 | 5.6 | |
| Majority | 689 | 23.6 | ||
| Turnout | 2914 | 30.0 | ||
| Labour hold | ||||
Drake
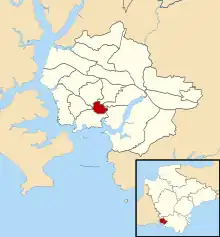
| Party | Candidate | Votes | % | |
|---|---|---|---|---|
| Labour | Chaz Singh | 589 | 37.1 | |
| Conservative | Andy Fox | 506 | 31.9 | |
| Liberal Democrats | Rebecca Jane Trimnell | 178 | 11.2 | |
| Green | Wendy Margaret Miller | 116 | 7.3 | |
| UKIP | Chris Palmer | 99 | 6.2 | |
| Independent | David Santillo | 97 | 6.1 | |
| Majority | 83 | 5.2 | ||
| Turnout | 1,585 | 33.8 | ||
| Labour gain from Conservative | ||||
Efford and Lipson

| Party | Candidate | Votes | % | |
|---|---|---|---|---|
| Labour Co-op | Pauline Murphy | 1,785 | 53.6 | |
| Conservative | Nick Kelly | 832 | 25.0 | |
| UKIP | Ramon Philip Fereday | 362 | 10.9 | |
| Liberal Democrats | Duncan Telford Beasley | 189 | 5.7 | |
| Green | Roger Michael Creagh-Osborne | 161 | 4.8 | |
| Majority | 953 | 28.6 | ||
| Turnout | 3,329 | 36.0 | ||
| Labour hold | ||||
Eggbuckland
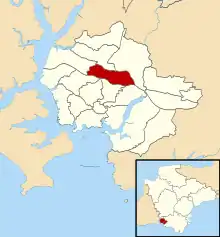
| Party | Candidate | Votes | % | |
|---|---|---|---|---|
| Conservative | Lynda Margaret Bowyer | 2,185 | 48.4 | |
| Labour | Mark Andrew Thompson | 1,670 | 37.0 | |
| UKIP | Roger Kenneth Thomas | 664 | 14.7 | |
| Majority | 953 | 21.1 | ||
| Turnout | 4,519 | 44.0 | ||
| Conservative hold | ||||
Ham
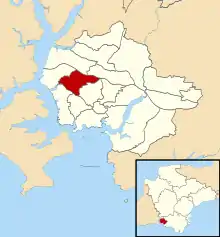
| Party | Candidate | Votes | % | |
|---|---|---|---|---|
| Labour Co-op | Tudor Evans | 1,843 | 54.7 | |
| Conservative | Tim Delbridge | 969 | 28.8 | |
| UKIP | Alan John Skuse | 558 | 16.6 | |
| Majority | 874 | 25.9 | ||
| Turnout | 3,370 | 35.0 | ||
| Labour hold | ||||
Honicknowle
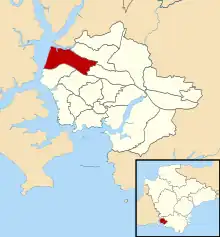
| Party | Candidate | Votes | % | |
|---|---|---|---|---|
| Labour | Mark John Lowry | 1,790 | 54.0 | |
| UKIP | Ron Northcott | 675 | 20.3 | |
| Conservative | Paul Rielly | 671 | 20.2 | |
| Green | David Wildman | 181 | 5.5 | |
| Majority | 1,115 | 33.6 | ||
| Turnout | 3,317 | 32.0 | ||
| Labour hold | ||||
Moor View
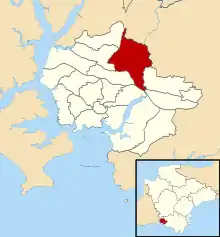
| Party | Candidate | Votes | % | |
|---|---|---|---|---|
| Labour | Alison Marie Casey | 2,049 | 55.3 | |
| Conservative | Mark Christie | 1,655 | 44.7 | |
| Majority | 394 | 10.6 | ||
| Turnout | 3,704 | 40.0 | ||
| Labour hold | ||||
Peverell
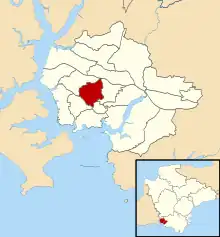
| Party | Candidate | Votes | % | |
|---|---|---|---|---|
| Conservative | John Mahoney | 2,059 | 45.5 | |
| Labour | Jonathan Taylor | 1,461 | 32.3 | |
| Liberal Democrats | Richard Lawrie | 604 | 13.3 | |
| UKIP | John Read | 405 | 8.9 | |
| Majority | 598 | 13.2 | ||
| Turnout | 4,529 | 45.0 | ||
| Conservative hold | ||||
Plympton Erle
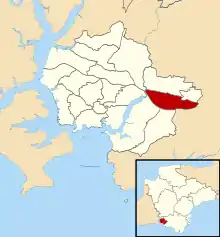
| Party | Candidate | Votes | % | |
|---|---|---|---|---|
| Conservative | Terri Beer | 1,597 | 55.2 | |
| Labour | Roger Williams | 834 | 28.8 | |
| UKIP | John Roberts | 461 | 15.9 | |
| Majority | 763 | 26.4 | ||
| Turnout | 2,892 | 42.5 | ||
| Conservative hold | ||||
Plympton St Mary
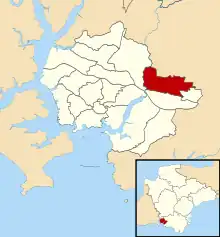
| Party | Candidate | Votes | % | |
|---|---|---|---|---|
| Conservative | Patrick John Nicholson | 2,687 | 59.8 | |
| Labour | Prathees Kristino Kishore | 943 | 21.0 | |
| UKIP | Jonathan Brian Frost | 581 | 12.9 | |
| Independent | James Alexander Sanderson | 281 | 6.3 | |
| Majority | 1,744 | 38.8 | ||
| Turnout | 4,492 | 45.1 | ||
| Conservative hold | ||||
Plymstock Dunstone
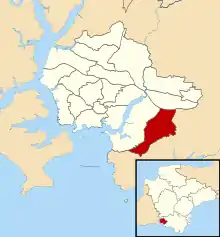
| Party | Candidate | Votes | % | |
|---|---|---|---|---|
| Conservative | Nigel Andrew Churchill | 2,201 | 49.4 | |
| Labour | Bethan Rose Davey | 955 | 21.5 | |
| Liberal Democrats | Sima Davarian | 515 | 11.6 | |
| UKIP | David Salmon | 781 | 17.5 | |
| Majority | 1,246 | 28.0 | ||
| Turnout | 4,452 | 46.0 | ||
| Conservative hold | ||||
Plymstock Radford
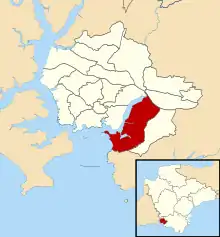
| Party | Candidate | Votes | % | |
|---|---|---|---|---|
| Conservative | Ken Foster | 2,132 | 50.4 | |
| Labour | Shirley Margaret Smith | 1,071 | 25.3 | |
| UKIP | Andrea Bullock | 599 | 14.2 | |
| Liberal Democrats | Michael James Symons | 430 | 10.2 | |
| Majority | 1,061 | 25.1 | ||
| Turnout | 4,232 | |||
| Conservative hold | ||||
St Budeax
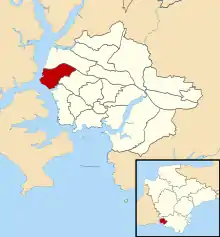
| Party | Candidate | Votes | % | |
|---|---|---|---|---|
| Labour | George William Wheeler | 1,901 | 57.2 | |
| Conservative | Stuart Bernard Charles | 844 | 25.4 | |
| UKIP | Paul Bedson | 579 | 17.4 | |
| Majority | 1,057 | 31.8 | ||
| Turnout | 3,324 | 34.0 | ||
| Labour gain from Conservative | ||||
St Peter and the Waterfront

| Party | Candidate | Votes | % | |
|---|---|---|---|---|
| Labour | Chris Penberthy | 1,607 | 24.5 | |
| Labour | Ian Glenn Tuffin | 1,383 | 21.1 | |
| Conservative | Tam MacPherson | 1,204 | 18.3 | |
| Conservative | Chris Robinson | 1,165 | 17.7 | |
| Liberal Democrats | Hugh Janes | 415 | 6.3 | |
| UKIP | Roy Alfred Kettle | 400 | 6.1 | |
| Green | Matt Ray | 396 | 6.0 | |
| Majority | 224 | 3.4 | ||
| Turnout | 6,570 | 34.8 | ||
| Labour hold | ||||
| Labour gain from Conservative | ||||
Southway

| Party | Candidate | Votes | % | |
|---|---|---|---|---|
| Labour | John David Smith | 6 | 53.3 | |
| Conservative | Brian William George Roberts | 1,839 | 46.7 | |
| Majority | 257 | 6.5 | ||
| Turnout | 3,935 | 41.0 | ||
| Labour gain from Conservative | ||||
Stoke

| Party | Candidate | Votes | % | |
|---|---|---|---|---|
| Labour Co-op | Philippa Davey | 1,875 | 48.2 | |
| Conservative | Joan Mary Watkins | 1,492 | 38.4 | |
| UKIP | Fiona Hurst-Baird | 520 | 13.4 | |
| Majority | 383 | 9.9 | ||
| Turnout | 3,887 | 41.0 | ||
| Labour gain from Conservative | ||||
Sutton and Mount Gould

| Party | Candidate | Votes | % | |
|---|---|---|---|---|
| Labour | Jean Florence Neider | 1,625 | 48.3 | |
| Conservative | Katy Hitchman | 822 | 22.4 | |
| UKIP | Jonquil Patricia Webber | 288 | 8.6 | |
| Green | Tean Jane Mitchell | 226 | 6.7 | |
| TUSC | Louise Anne Parker | 75 | 2.2 | |
| Liberal Democrats | Peter York | 327 | 9.7 | |
| Majority | 806 | 24.0 | ||
| Turnout | 3,363 | 34.7 | ||
| Labour hold | ||||
References
- "Vote 2012 - Plymouth". BBC News.
- "Plymouth Herald, 6 May 2011, Rossiter, Keith., Labour gain five seats in Plymouth City Council elections but Tories hold power". Archived from the original on 9 May 2011. Retrieved 6 May 2011.
- "Election 2011 - England council elections". BBC News. Retrieved 27 December 2018.
- "Local government structure and elections". GOV.UK. Retrieved 27 April 2018.
- "Election Timetable in England" (PDF).
- "Past election results | PLYMOUTH.GOV.UK". www.plymouth.gov.uk. Archived from the original on 28 April 2018. Retrieved 27 April 2018.
- "| PLYMOUTH.GOV.UK". www.plymouth.gov.uk.