2011 Maidstone Borough Council election
Elections to Maidstone Borough Council were held on 5 May 2011. One-third of the borough council (20 members) were up for election. Parish council elections and the national Alternative Vote referendum were held on the same day.
| |||||||||||||||||||||||||
20 members | |||||||||||||||||||||||||
|---|---|---|---|---|---|---|---|---|---|---|---|---|---|---|---|---|---|---|---|---|---|---|---|---|---|
| Turnout | 43% | ||||||||||||||||||||||||
| |||||||||||||||||||||||||
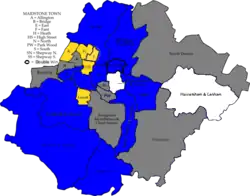 Map of Borough Election Results 2011, Colour legend by wards won: Conservative Party Liberal Democrats
Independents Wards in grey were not contested in 2011 | |||||||||||||||||||||||||
| |||||||||||||||||||||||||
Overall results
The Conservatives stayed in overall control of the council by gaining two seats. The Liberal Democrats lost two seats.
| Maidstone Borough Council[1][2] | ||||
|---|---|---|---|---|
| Party | Elected Seats | Total Seats | +/- | |
| Conservative Party | 12 | 30 | +2 | |
| Liberal Democrats | 6 | 21 | -2 | |
| Independent | 2 | 4 | 0 | |
| Total | 20 | 55 | ||
| Valid Ballot Papers | ||||
| Rejected Ballot Papers | 226 | |||
| Ballot Papers Issued | ||||
| Registered Electors | 87,445 | |||
| Turnout | 43% | |||
Ward results
| Allington Ward (1)[3] | ||||
|---|---|---|---|---|
| Candidate | Party | Votes | % | |
| Cynthia Robertson | Liberal Democrats | 1,345 | 48.45% | |
| Barry Stephen Ginley | Conservative Party | 1,048 | 37.75% | |
| Wendy Florence Hollands | Labour Party | 383 | 13.80% | |
| Total | 2,776 | 100.00% | ||
| Rejected Ballot Papers | 9 | |||
| Ballot Papers Issued | 2,785 | |||
| Registered Electors | 5,518 | |||
| Turnout | 50.47% | |||
| Bearsted Ward (2)[4] | |||||
|---|---|---|---|---|---|
| Candidate | Party | Votes | % (Total) | % (Valid) | |
| Val Springett | Conservative Party | 1,754 | 30.17% | ||
| Mike Cuming | Conservative Party | 1,555 | 26.75% | ||
| Pat Marshall | Independent | 1,395 | 23.99% | ||
| Jim Grogan | Labour Party | 432 | 7.43% | ||
| Gill Annan | Labour Party | 281 | 4.83% | ||
| Ciaran Dominic Oliver | Green Party | 215 | 3.70% | ||
| Sarah Ann Goodwin | Green Party | 182 | 3.13% | ||
| Total | 5,814 | 100.00% | |||
| Valid Ballot Papers | |||||
| Rejected Ballot Papers | 36 | ||||
| Ballot Papers Issued | |||||
| Registered Electors | 6,616 | ||||
| Turnout | |||||
| Boxley Ward (1)[5] | ||||
|---|---|---|---|---|
| Candidate | Party | Votes | % | |
| Malcolm Frank Greer | Conservative Party | 1,350 | 50.89% | |
| Michael John Beckwith | Labour Party | 862 | 32.49% | |
| John Peter Watson | Liberal Democrats | 264 | 9.95% | |
| Penny Kemp | Green Party | 177 | 6.67% | |
| Total | 2,653 | 100.00% | ||
| Rejected Ballot Papers | 12 | |||
| Ballot Papers Issued | 2,665 | |||
| Registered Electors | 6,446 | |||
| Turnout | 41.34% | |||
| Coxheath & Hunton Ward (1)[6] | ||||
|---|---|---|---|---|
| Candidate | Party | Votes | % | |
| Dennis Harold Collins | Conservative Party | 1,247 | 46.51% | |
| David Michael Stamp | Liberal Democrats | 915 | 34.13% | |
| Stella Marlyn Randall | Labour Party | 265 | 9.88% | |
| Keith Clement Woollven | UK Independence Party | 140 | 5.22% | |
| Robin James Kinrade | Green Party | 114 | 4.25% | |
| Total | 2,681 | 100.00% | ||
| Rejected Ballot Papers | 12 | |||
| Ballot Papers Issued | 2,693 | |||
| Registered Electors | 5,754 | |||
| Turnout | 46.80% | |||
| Detling & Thurnham Ward (1)[7] | ||||
|---|---|---|---|---|
| Candidate | Party | Votes | % | |
| Nick de Wiggondene | Conservative Party | 628 | 59.13% | |
| Geoffrey Frank Licence | Independent | 291 | 27.40% | |
| Paul Michael Blackmore | Labour Party | 143 | 13.47% | |
| Total | 1,062 | 100.00% | ||
| Rejected Ballot Papers | 13 | |||
| Ballot Papers Issued | 1,075 | |||
| Registered Electors | 2,344 | |||
| Turnout | 45.86% | |||
| Downswood & Otham Ward (1)[8] | ||||
|---|---|---|---|---|
| Candidate | Party | Votes | % | |
| Gordon William Newton | Independent | 451 | 51.72% | |
| Gary Cooke | Conservative Party | 310 | 35.55% | |
| Steve Gibson | Labour Party | 84 | 9.63% | |
| Andrew Crawford Waldie | Green Party | 27 | 3.10% | |
| Total | 872 | 100.00% | ||
| Rejected Ballot Papers | 4 | |||
| Ballot Papers Issued | 876 | |||
| Registered Electors | 2,107 | |||
| Turnout | 41.58% | |||
| East Ward (2)[9] | |||||
|---|---|---|---|---|---|
| Candidate | Party | Votes | % (Total) | % (Valid) | |
| David Sandru Naghi | Liberal Democrats | 1,286 | 24.43% | ||
| Martin Ashley Richard Cox | Liberal Democrats | 1,281 | 24.34% | ||
| Tony Dennison | Conservative Party | 1,010 | 19.19% | ||
| Scott Hahnefeld | Conservative Party | 858 | 16.30% | ||
| Bruce Henry Heald | Labour Party | 316 | 6.00% | ||
| Caroline Burns | Green Party | 270 | 5.13% | ||
| Hannah Margaret Patton | Green Party | 242 | 4.60% | ||
| Total | 5,263 | 100.00% | |||
| Valid Ballot Papers | |||||
| Rejected Ballot Papers | 19 | ||||
| Ballot Papers Issued | |||||
| Registered Electors | 6,500 | ||||
| Turnout | |||||
| Fant Ward (1)[10] | ||||
|---|---|---|---|---|
| Candidate | Party | Votes | % | |
| Alistair James Black | Conservative Party | 727 | 29.60% | |
| Fran Smith | Liberal Democrats | 661 | 26.91% | |
| Paul Harper | Labour Party | 542 | 22.07% | |
| Stuart Robert Jeffery | Green Party | 526 | 21.42% | |
| Total | 2,456 | 100.00% | ||
| Rejected Ballot Papers | 14 | |||
| Ballot Papers Issued | 2,470 | |||
| Registered Electors | 6,519 | |||
| Turnout | 37.89% | |||
| Harrietsham & Lenham Ward (1)[11] | ||||
|---|---|---|---|---|
| Candidate | Party | Votes | % | |
| Tom Sams | Independent | 1,175 | 55.32% | |
| Marino (Maz) Michaelas | Conservative Party | 827 | 38.94% | |
| Jeanne Mary Gibson | Labour Party | 122 | 5.74% | |
| Total | 2,124 | 100.00% | ||
| Rejected Ballot Papers | 9 | |||
| Ballot Papers Issued | 2,133 | |||
| Registered Electors | 4,396 | |||
| Turnout | 48.52% | |||
| High Street Ward (1)[12] | ||||
|---|---|---|---|---|
| Candidate | Party | Votes | % | |
| Fran Wilson | Liberal Democrats | 853 | 41.45% | |
| Valerie Katharine Parker | Conservative Party | 533 | 25.90% | |
| Marianna Romeojuliet Poliszczuk | Labour Party | 333 | 16.18% | |
| Wendy Kathleen Lewis | Green Party | 176 | 8.55% | |
| UK Independence Party | UK Independence Party | 163 | 7.92% | |
| Total | 2,058 | 100.00% | ||
| Rejected Ballot Papers | 11 | |||
| Ballot Papers Issued | 2,069 | |||
| Registered Electors | 6,367 | |||
| Turnout | 32.50% | |||
| Leeds Ward (1)[13] | ||||
|---|---|---|---|---|
| Candidate | Party | Votes | % | |
| Peter James Dudley Parvin | Conservative Party | 623 | 66.35% | |
| Juliet Maria Maddocks | Independent | 187 | 19.91% | |
| Maggie Lack | Labour Party | 129 | 13.74% | |
| Total | 939 | 100.00% | ||
| Rejected Ballot Papers | 3 | |||
| Ballot Papers Issued | 942 | |||
| Registered Electors | 1,869 | |||
| Turnout | 50.40% | |||
| Loose Ward (1)[14] | ||||
|---|---|---|---|---|
| Candidate | Party | Votes | % | |
| Susan Jane Grigg | Liberal Democrats | 519 | 50.49% | |
| Steve Sheppard | Conservative Party | 413 | 40.18% | |
| Joshua Amos | Labour Party | 49 | 4.77% | |
| Denise Joy Hay | Green Party | 47 | 4.57% | |
| Total | 1,028 | 100.00% | ||
| Rejected Ballot Papers | 5 | |||
| Ballot Papers Issued | 1,033 | |||
| Registered Electors | 1,960 | |||
| Turnout | 52.70% | |||
| Marden & Yalding Ward (1)[15] | ||||
|---|---|---|---|---|
| Candidate | Party | Votes | % | |
| Annabelle Blackmore | Conservative Party | 1,612 | 63.41% | |
| Carol Ann Jacques | Liberal Democrats | 425 | 16.72% | |
| Edith Maud Davis | Labour Party | 317 | 12.47% | |
| James Edward Shalice | Green Party | 188 | 7.40% | |
| Total | 2,542 | 100.00% | ||
| Rejected Ballot Papers | 20 | |||
| Ballot Papers Issued | 2,562 | |||
| Registered Electors | 5,813 | |||
| Turnout | 44.07% | |||
| North Ward (1)[16] | ||||
|---|---|---|---|---|
| Candidate | Party | Votes | % | |
| Mervyn Dyke Warner | Liberal Democrats | 871 | 38.29% | |
| Jeff Tree | Conservative Party | 782 | 34.37% | |
| Keith Adkinson | Labour Party | 330 | 14.51% | |
| Charles Richard Elliott | UK Independence Party | 152 | 6.68% | |
| Derek Roy Eagle | Green Party | 140 | 6.15% | |
| Total | 2,275 | 100.00% | ||
| Rejected Ballot Papers | 10 | |||
| Ballot Papers Issued | 2,285 | |||
| Registered Electors | 6,066 | |||
| Turnout | 37.67% | |||
| Shepway North Ward (1)[17] | ||||
|---|---|---|---|---|
| Candidate | Party | Votes | % | |
| Marion Ann Ring | Conservative Party | 1,139 | 52.25% | |
| Geoff Harvey | Labour Party | 589 | 27.02% | |
| Geoffrey Richard Samme | Liberal Democrats | 193 | 8.85% | |
| Stephen Fraser Muggeridge | Green Party | 157 | 7.20% | |
| Gary Butler | British National Party | 102 | 4.68% | |
| Total | 2,180 | 100.00% | ||
| Rejected Ballot Papers | 8 | |||
| Ballot Papers Issued | 2,188 | |||
| Registered Electors | 6,504 | |||
| Turnout | 33.64% | |||
| South Ward (1)[18] | ||||
|---|---|---|---|---|
| Candidate | Party | Votes | % | |
| Mike Hogg | Conservative Party | 1,242 | 45.15% | |
| John Wilson | Liberal Democrats | 1,171 | 42.57% | |
| Richard John Coates | Labour Party[19] | 338 | 12.29% | |
| Total | 2,751 | 100.00% | ||
| Rejected Ballot Papers | 20 | |||
| Ballot Papers Issued | 2,771 | |||
| Registered Electors | 6,258 | |||
| Turnout | 44.28% | |||
| Staplehurst Ward (1)[20] | ||||
|---|---|---|---|---|
| Candidate | Party | Votes | % | |
| Richard Lusty | Conservative Party | 1,211 | 64.59% | |
| John Edward Randall | Labour Party | 288 | 15.36% | |
| Ralph Frederick Austin | Liberal Democrats | 228 | 12.16% | |
| Ian Francis Stewart McDonald | Green Party | 148 | 7.89% | |
| Total | 1,875 | 100.00% | ||
| Rejected Ballot Papers | 15 | |||
| Ballot Papers Issued | 1,890 | |||
| Registered Electors | 4,349 | |||
| Turnout | 43.46% | |||
| Sutton Valence & Langley Ward (1)[21] | ||||
|---|---|---|---|---|
| Candidate | Party | Votes | % | |
| Paulina Annette Veronica Stockell | Conservative Party | 735 | 73.28% | |
| Jean Harvey | Labour Party | 156 | 15.55% | |
| Susan Austin | Liberal Democrats | 112 | 11.17% | |
| Total | 1,003 | 100.00% | ||
| Rejected Ballot Papers | 6 | |||
| Ballot Papers Issued | 1,009 | |||
| Registered Electors | 2,059 | |||
| Turnout | 49.00% | |||
References & notes
- "Maidstone Borough Council Local Election 2011 - Thursday 5th May, 2011". Maidstone Borough Council.
- "England council elections". BBC News. 6 May 2011.
- "Election results for Allington Ward". Maidstone Borough Council.
- "Election results for Bearsted Ward". Maidstone Borough Council.
- "Election results for Boxley Ward". Maidstone Borough Council.
- "Election results for Coxheath and Hunton Ward". Maidstone Borough Council.
- "Election results for Detling and Thurnham Ward". Maidstone Borough Council.
- "Election results for Downswood and Otham Ward". Maidstone Borough Council.
- "Election results for East Ward". Maidstone Borough Council.
- "Election results for Fant Ward". Maidstone Borough Council.
- "Election results for Harrietsham and Lenham Ward". Maidstone Borough Council.
- "Election results for High Street Ward". Maidstone Borough Council.
- "Election results for Leeds Ward". Maidstone Borough Council.
- "Election results for Loose Ward". Maidstone Borough Council.
- "Election results for Marden and Yalding Ward". Maidstone Borough Council.
- "Election results for North Ward". Maidstone Borough Council.
- "Election results for Shepway North Ward". Maidstone Borough Council.
- "Election results for South Ward". Maidstone Borough Council.
- Labour and Co-operative Party
- "Election results for Staplehurst Ward". Maidstone Borough Council.
- "Election results for Sutton Valence and Langley Ward". Maidstone Borough Council.
| Kent County Council | |
|---|---|
| Ashford Borough Council | |
| Canterbury City Council | |
| Dartford Borough Council | |
| Dover District Council | |
| Folkestone & Hythe District Council | |
| Gravesham Borough Council | |
| Maidstone Borough Council | |
| Medway Council | |
| Sevenoaks District Council | |
| Swale Borough Council | |
| Thanet District Council | |
| Tonbridge & Malling Borough Council | |
| Tunbridge Wells Borough Council | |
| Rochester-upon-Medway City Council |
|
| Gillingham Borough Council |
|
| |
This article is issued from Wikipedia. The text is licensed under Creative Commons - Attribution - Sharealike. Additional terms may apply for the media files.