2008 Plymouth City Council election
The 2008 Plymouth City Council election was held on 1 May 2008 to elect members of Plymouth City Council in England. One third of the council was up for election and the Conservative Party remained in control of the council with an increased majority.[2][3]
| |||||||||||||||||||||||||
19 of the 57 seats to Plymouth City Council 29 seats needed for a majority | |||||||||||||||||||||||||
|---|---|---|---|---|---|---|---|---|---|---|---|---|---|---|---|---|---|---|---|---|---|---|---|---|---|
| |||||||||||||||||||||||||
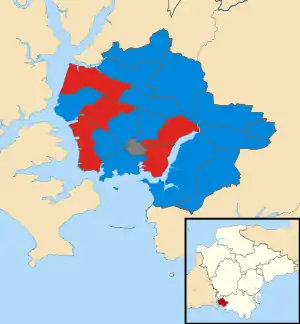 Map showing the results of contested wards in the 2008 Plymouth City Council elections. | |||||||||||||||||||||||||
| |||||||||||||||||||||||||
Overall results
| Party | Seats | Gains | Losses | Net gain/loss | Seats % | Votes % | Votes | +/− | |
|---|---|---|---|---|---|---|---|---|---|
| Conservative | 14 | 6 | 0 | 73.7 | 47.3 | 28,041 | |||
| Labour | 5 | 0 | 6 | 26.3 | 27.1 | 16,063 | |||
| Liberal Democrats | 0 | 0 | 0 | 0.0 | 13.7 | 8,115 | |||
| UKIP | 0 | 0 | 0 | 0.0 | 4.5 | 2,655 | |||
| Green | 0 | 0 | 0 | 0.0 | 4.6 | 2,710 | |||
| Independent | 0 | 0 | 0 | 0.0 | 2.0 | 1,173 | |||
| BNP | 0 | 0 | 0 | 0.0 | 1.0 | 571 | |||
| Total | 19 | 59,328 | |||||||
Note: All changes in vote share are in comparison to the corresponding 2004 election.
Ward results
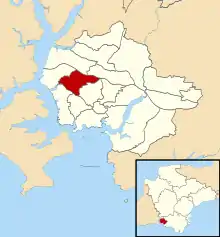
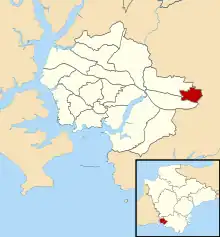
Budshead
Location of Budshead ward
| Party | Candidate | Votes | % | |
|---|---|---|---|---|
| Conservative | Jack Thompson | 1,717 | 53.8% | |
| Labour | Chris Mavin | 987 | 30.9% | |
| Liberal Democrats | Tracy Lang | 488 | 15.3% | |
| Majority | 730 | 22.9% | ||
| Turnout | 3,192 | 33.9% | ||
| Conservative gain from Labour | ||||
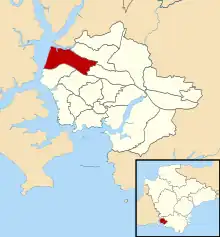
Compton
Location of Compton ward
| Party | Candidate | Votes | % | |
|---|---|---|---|---|
| Conservative | Richard Ball | 1,947 | 57.6% | |
| Liberal Democrats | Emma Swann | 478 | 14.1% | |
| Labour | Ross Burns | 470 | 13.9% | |
| Green | Josie Bannon | 252 | 7.5% | |
| UKIP | Andrew Leigh | 234 | 6.9% | |
| Majority | 1,469 | 43.4% | ||
| Turnout | 3,381 | 37.5% | ||
| Conservative hold | ||||
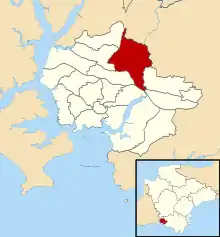
Devonport

Location of Devonport ward
| Party | Candidate | Votes | % | |
|---|---|---|---|---|
| Labour | Nicola Wildy | 1,050 | 41.8% | |
| Conservative | Betty Gray | 954 | 38.0% | |
| Liberal Democrats | Charles Earl | 310 | 12.3% | |
| Green | Colin Bannon | 198 | 7.9% | |
| Majority | 96 | 3.8% | ||
| Turnout | 2,512 | 27.0% | ||
| Labour hold | ||||
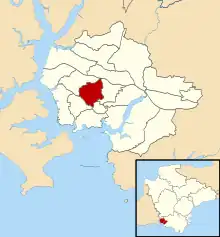
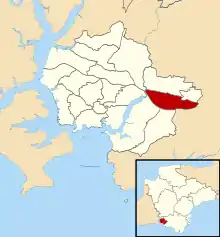
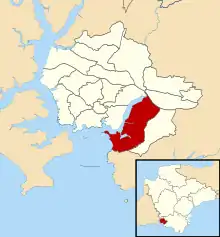
Efford and Lipson

Location of Efford and Lipson ward
| Party | Candidate | Votes | % | |
|---|---|---|---|---|
| Labour | Brian Vincent | 1,366 | 44.5% | |
| Conservative | Mary Orchard | 1,055 | 34.3% | |
| Liberal Democrats | Simon Hayes | 387 | 12.6% | |
| Green | Colin Trier | 2,658.6% | ||
| Majority | 311 | 10.1% | ||
| Turnout | 3,073 | 32.2% | ||
| Labour hold | ||||
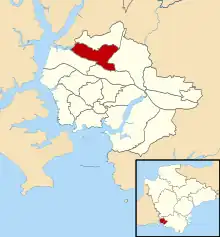
Eggbuckland
Location of Eggbuckland ward
| Party | Candidate | Votes | % | |
|---|---|---|---|---|
| Conservative | Peter Brookshaw | 1,828 | 47.2% | |
| Labour | John Smith | 861 | 22.2% | |
| Independent | Lee Finn | 682 | 17.6% | |
| Liberal Democrats | Laura Walker | 333 | 8.6% | |
| Green | Raymond Delamare | 170 | 4.4% | |
| Majority | 967 | 25.0% | ||
| Turnout | 3,874 | 37.9% | ||
| Conservative hold | ||||
Ham
Location of Ham ward
| Party | Candidate | Votes | % | |
|---|---|---|---|---|
| Labour | Christopher Pattison | 1,207 | 41.3% | |
| Conservative | Frederick Brimacombe | 1,158 | 39.6% | |
| Liberal Democrats | Stephen Goldthorpe | 387 | 13.2% | |
| Green | Andrew Pratt | 173 | 5.9% | |
| Majority | 49 | 1.7% | ||
| Turnout | 2,925 | 30.3% | ||
| Labour hold | ||||
Honicknowle
Location of Honicknowle ward
| Party | Candidate | Votes | % | |
|---|---|---|---|---|
| Labour | Peter Smith | 1,135 | 41.4% | |
| Conservative | Paul Rielly | 935 | 34.1% | |
| Liberal Democrats | Gillian Hirst | 433 | 15.8% | |
| Green | Nicholas Byrne | 241 | 8.8% | |
| Majority | 200 | 7.3% | ||
| Turnout | 2,744 | 26.9% | ||
| Labour hold | ||||
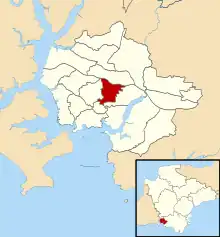
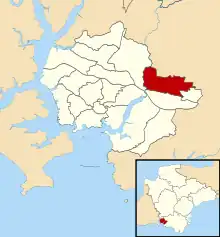
Moor View
Location of Moor View ward
| Party | Candidate | Votes | % | |
|---|---|---|---|---|
| Conservative | Edward Delbridge | 1,453 | 43.7% | |
| Labour | Paul Hutchings | 1,153 | 34.7% | |
| Liberal Democrats | David Jolly | 311 | 9.4% | |
| UKIP | Richard Barrett | 297 | 8.9% | |
| Green | Nicola Bannon | 111 | 3.3% | |
| Majority | 300 | 9.0% | ||
| Turnout | 3,325 | 35.8% | ||
| Conservative gain from Labour | ||||
Peverell
Location of Peverell ward
| Party | Candidate | Votes | % | |
|---|---|---|---|---|
| Conservative | Patricia Nicholson | 2,036 | 55.1% | |
| Labour | John Sewell | 626 | 17.0% | |
| Green | Don Allen | 521 | 14.1% | |
| Liberal Democrats | Deborah Earl | 510 | 13.8% | |
| Majority | 1,410 | 38.2% | ||
| Turnout | 3,693 | 36.9% | ||
| Labour hold | ||||
Plympton Chaddlewood
Location of Plympton Chaddlewood ward
| Party | Candidate | Votes | % | |
|---|---|---|---|---|
| Conservative | David Salter | 1,133 | 60.0% | |
| Labour | Pauline Murphy | 300 | 15.9% | |
| UKIP | Jonathan Frost | 233 | 12.3% | |
| Liberal Democrats | Steve Barton | 223 | 11.8% | |
| Majority | 833 | 44.1% | ||
| Turnout | 1,889 | 33.8% | ||
| Conservative hold | ||||
Plympton Erle
Location of Plympton Erle ward
| Party | Candidate | Votes | % | |
|---|---|---|---|---|
| Conservative | John Lock | 1,499 | 60.4% | |
| Labour | Valerie Burns | 391 | 15.8% | |
| Liberal Democrats | Wesley Rowe | 347 | 14.0% | |
| UKIP | John Roberts | 243 | 9.8% | |
| Majority | 1,108 | 44.7% | ||
| Turnout | 2,480 | 36.2% | ||
| Conservative hold | ||||
Note: This Plympton Erle seat was won by Lock for the Liberal Democrats the previous time it was contested in 2004, but he defected to the Conservatives in 2007.[4]
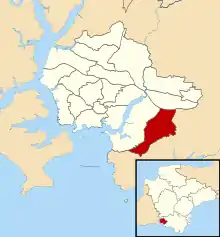
Plympton St Mary
Location of Plympton St Mary ward
| Party | Candidate | Votes | % | |
|---|---|---|---|---|
| Conservative | Samantha Leaves | 2,283 | 61.3% | |
| Labour | Darren Jones | 461 | 12.4% | |
| Liberal Democrats | Liz Barton | 385 | 10.3% | |
| Independent | James Sanderson | 304 | 8.2% | |
| UKIP | Hugh Williams | 291 | 7.8% | |
| Majority | 1,822 | 48.9% | ||
| Turnout | 3,724 | 37.3% | ||
| Conservative hold | ||||
Plymstock Dunstone
Location of Plymstock Dunstone ward
| Party | Candidate | Votes | % | |
|---|---|---|---|---|
| Conservative | Kevin Wigens | 2,300 | 59.2% | |
| Liberal Democrats | Stephen Kearney | 636 | 16.4% | |
| Labour | Mike Fox | 477 | 12.3% | |
| UKIP | Alan Skuse | 417 | 10.7% | |
| Independent | Bruce Abbott | 53 | 1.4% | |
| Majority | 1,664 | 42.9% | ||
| Turnout | 3,883 | 39.8% | ||
| Conservative hold | ||||
Plymstock Radford
Location of Plymstock Radford ward
| Party | Candidate | Votes | % | |
|---|---|---|---|---|
| Conservative | Michael Leaves | 1,962 | 54.5% | |
| Labour | Julia Olsen | 686 | 19.0% | |
| UKIP | Roger Bullock | 508 | 14.1% | |
| Liberal Democrats | Steven Lemin | 447 | 12.4% | |
| Majority | 1,276 | 35.4% | ||
| Turnout | 3,603 | 37.3% | ||
| Conservative hold | ||||
St Budeax
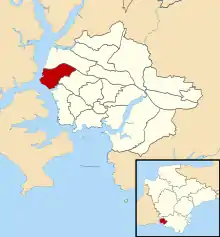
Location of St Budeaux ward
| Party | Candidate | Votes | % | |
|---|---|---|---|---|
| Conservative | Gloria Bragg | 1,003 | 36.5% | |
| Labour | Margaret Storer | 983 | 35.7% | |
| Liberal Democrats | Ray McSweeney | 559 | 20.3% | |
| Green | Roger Creagh-Osborne | 205 | 7.5% | |
| Majority | 20 | 0.7% | ||
| Turnout | 2,750 | 28.7% | ||
| Conservative gain from Labour | ||||
St Peter and the Waterfront

Location of St Peter and the Waterfront ward
| Party | Candidate | Votes | % | |
|---|---|---|---|---|
| Conservative | Sally Stephens | 1,064 | 36.6% | |
| Labour | Valentine Hiromeris | 995 | 34.2% | |
| Liberal Democrats | Christina MacCullie | 264 | 9.1% | |
| BNP | Michael Antonucci | 233 | 8.0% | |
| UKIP | Sean O'Kane | 216 | 7.4% | |
| Independent | Jo Jo | 134 | 4.6% | |
| Majority | 69 | 2.4% | ||
| Turnout | 2,906 | 30.7% | ||
| Conservative gain from Labour | ||||
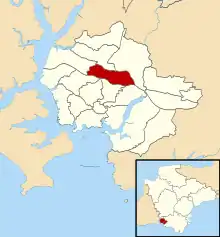
Southway

Location of Southway ward
| Party | Candidate | Votes | % | |
|---|---|---|---|---|
| Conservative | Peter Berrow | 1,318 | 38.8% | |
| Labour | David Weekes | 1,155 | 34.0% | |
| Liberal Democrats | Jane Barwick | 583 | 17.2% | |
| BNP | Lawrence Miller | 338 | 10.0% | |
| Majority | 163 | 4.8% | ||
| Turnout | 3,394 | % | ||
| Conservative gain from Labour | ||||
Stoke

Location of Stoke ward
| Party | Candidate | Votes | % | |
|---|---|---|---|---|
| Conservative | David Reynolds | 1,500 | 46.3% | |
| Labour | David Haydon | 1,014 | 31.3% | |
| Liberal Democrats | Kirsty Barwick | 382 | 11.8% | |
| Green | Wendy Miller | 347 | 10.7% | |
| Majority | 486 | 15.0% | ||
| Turnout | 3,243 | 34.8% | ||
| Conservative gain from Labour | ||||
Sutton and Mount Gould

Location of Sutton and Mount Gould ward
| Party | Candidate | Votes | % | |
|---|---|---|---|---|
| Labour | Edwin Rennie | 985 | 36.0% | |
| Conservative | Edmund Shillabeer | 896 | 32.7% | |
| Liberal Democrats | Peter York | 413 | 15.1% | |
| Green | Tean Mitchell | 227 | 8.3% | |
| UKIP | Jonquil Webber | 216 | 7.9% | |
| Majority | 89 | 3.3% | ||
| Turnout | 2,737 | 28.2% | ||
| Labour hold | ||||
See also
References
- "Local elections: Plymouth". BBC News.
- "Local elections 2008" (PDF). parliament.uk.
- "Local Election Results 2008". Andrew Teale.
- "Council defector not to quit seat". BBC News. 25 January 2007.
- "| PLYMOUTH.GOV.UK". www.plymouth.gov.uk.
This article is issued from Wikipedia. The text is licensed under Creative Commons - Attribution - Sharealike. Additional terms may apply for the media files.