1896 United States presidential election in Vermont
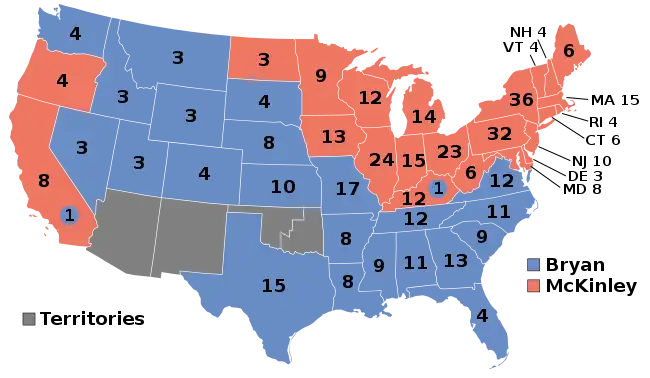
The 1896 United States presidential election in Vermont took place on November 3, 1896, as part of the 1896 United States presidential election. Voters chose four representatives, or electors to the Electoral College, who voted for president and vice president.
| |||||||||||||||||||||||||||||
| |||||||||||||||||||||||||||||
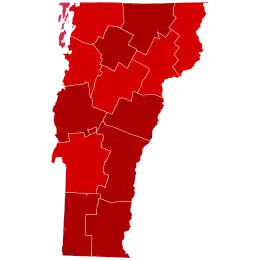 County Results
McKinley 60-70% 70-80% 80-90%
| |||||||||||||||||||||||||||||
| |||||||||||||||||||||||||||||
.jpg.webp)
.jpg.webp)
| Elections in Vermont |
|---|
.svg.png.webp) |
Vermont overwhelmingly voted for the Republican nominee, former Governor of Ohio William McKinley, over the Democratic nominee, former U.S. Representative from Nebraska William Jennings Bryan. With 80.08% of the popular vote, Vermont would be McKinley's strongest victory in the 1896 presidential election in terms of percentage in the popular vote, and remains the best performance of any presidential candidate in the Green Mountain State to date.[1] McKinley won Vermont by a landslide margin of 63.42%, which is the second-best performance by the Republican Party in a state in any presidential election behind only Barry Goldwater in Mississippi in 1964 – ironically the first election when the Green Mountain State deserted the GOP.[2]
Bryan, running on a platform of free silver, appealed strongly to Western miners and farmers in the 1896 election, but had practically no appeal in the Northeastern state of Vermont. In fact, with only 16.66% of the popular vote Bryan's performance in Vermont was the second weakest of any Democratic presidential candidate to date only after John W. Davis' 15.67% in 1924.
Bryan would lose Vermont to McKinley again four years later and would later lose the state again in 1908 to William Howard Taft.
Results
| 1896 United States presidential election in Vermont[3] | ||||||||
|---|---|---|---|---|---|---|---|---|
| Party | Candidate | Running mate | Popular vote | Electoral vote | ||||
| Count | % | Count | % | |||||
| Republican | William McKinley of Ohio | Garret Hobart of New Jersey | 51,127 | 80.08% | 4 | 100.00% | ||
| Democratic | William Jennings Bryan of Nebraska | Arthur Sewall of Maine | 10,640 | 16.66% | 0 | 0.00% | ||
| National Democratic | John McAuley Palmer of Illinois | Simon Bolivar Buckner of Kentucky | 1,331 | 2.08% | 0 | 0.00% | ||
| Prohibition | Joshua Levering of Maryland | Hale Johnson of Illinois | 733 | 1.15% | 0 | 0.00% | ||
| N/A | Others | Others | 16 | 0.03% | 0 | 0.00% | ||
| Total | 63,847 | 100.00% | 4 | 100.00% | ||||
Results by county
| County | William McKinley Republican |
William Jennings Bryan Democratic |
John McAuley Palmer[4] National Democratic |
Joshua Levering[4] Prohibition |
Margin | Total votes cast[5] | |||||
|---|---|---|---|---|---|---|---|---|---|---|---|
| # | % | # | % | # | % | # | % | # | % | ||
| Addison | 4,314 | 89.17% | 404 | 8.35% | 36 | 0.74% | 81 | 1.68% | 3,910 | 80.82% | 4,838 |
| Bennington | 3,086 | 80.39% | 656 | 17.09% | 61 | 1.59% | 36 | 0.94% | 2,430 | 63.30% | 3,839 |
| Caledonia | 3,474 | 78.65% | 729 | 16.50% | 120 | 2.72% | 94 | 2.13% | 2,745 | 62.15% | 4,417 |
| Chittenden | 4,743 | 75.26% | 1,416 | 22.47% | 89 | 1.41% | 54 | 0.86% | 3,327 | 52.79% | 6,302 |
| Essex | 873 | 72.99% | 277 | 23.16% | 33 | 2.76% | 13 | 1.09% | 596 | 49.83% | 1,196 |
| Franklin | 3,444 | 72.16% | 1,150 | 24.09% | 107 | 2.24% | 72 | 1.51% | 2,294 | 48.06% | 4,773 |
| Grand Isle | 426 | 69.04% | 158 | 25.61% | 31 | 5.02% | 2 | 0.32% | 268 | 43.44% | 617 |
| Lamoille | 2,061 | 80.79% | 440 | 17.25% | 23 | 0.90% | 27 | 1.06% | 1,621 | 63.54% | 2,551 |
| Orange | 3,067 | 80.20% | 567 | 14.83% | 121 | 3.16% | 69 | 1.80% | 2,500 | 65.38% | 3,824 |
| Orleans | 3,412 | 86.25% | 442 | 11.17% | 56 | 1.42% | 46 | 1.16% | 2,970 | 75.08% | 3,956 |
| Rutland | 6,794 | 78.00% | 1,661 | 19.07% | 161 | 1.85% | 89 | 1.02% | 5,133 | 58.93% | 8,710 |
| Washington | 4,476 | 73.10% | 1,396 | 22.80% | 177 | 2.89% | 66 | 1.08% | 3,080 | 50.30% | 6,123 |
| Windham | 4,829 | 84.14% | 670 | 11.67% | 190 | 3.31% | 50 | 0.87% | 4,159 | 72.47% | 5,739 |
| Windsor | 6,128 | 88.02% | 674 | 9.68% | 126 | 1.81% | 34 | 0.49% | 5,454 | 78.34% | 6,962 |
| Totals | 51,127 | 80.08% | 10,640 | 16.66% | 1,331 | 2.08% | 733 | 1.15% | 40,487 | 63.41% | 63,847 |
References
- "1896 Presidential Election Statistics". Dave Leip’s Atlas of U.S. Presidential Elections. Retrieved March 5, 2018.
- "Historical U.S. Presidential Elections 1789-2020 - 270toWin". 270toWin.com. Retrieved August 4, 2022.
- "1896 Presidential General Election Results - Vermont". U.S. Election Atlas. Retrieved December 23, 2013.
- Géoelections; Popular Vote at the Presidential Election for 1896 (.xlsx file for €30 including full minor party figures)
- Robinson, Edgar Eugene; The Presidential Vote 1896-1932, pp. 352-354 ISBN 9780804716963