2012 United States presidential election in Vermont
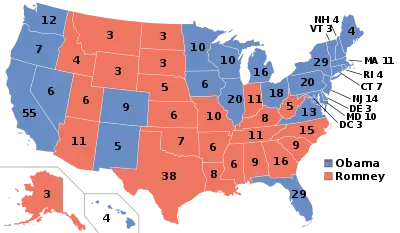
The 2012 United States presidential election in Vermont took place on November 6, 2012, as part of the 2012 United States presidential election in which all 50 states plus the District of Columbia participated. Vermont voters chose three electors to represent them in the Electoral College via a popular vote pitting incumbent Democratic President Barack Obama and his running mate, Vice President Joe Biden, against Republican challenger and former Massachusetts Governor Mitt Romney and his running mate, Congressman Paul Ryan.
| ||||||||||||||||||||||||||
| ||||||||||||||||||||||||||
| ||||||||||||||||||||||||||
| ||||||||||||||||||||||||||
| Elections in Vermont |
|---|
.svg.png.webp) |
A very liberal Northeastern state, and a former bastion of progressive Republicanism until the realignment election of 1992, Vermont was the second most Democratic state in the nation, weighing in as a whopping 31.74% more Democratic than the national average in the 2012 election. Repeating his success from 2008, Obama again carried Vermont in a landslide, taking 66.57% of the vote to Romney's 30.97%, a Democratic victory margin of 35.60%. Though this was slightly worse than his 2008 performance, when he received 67.46% of the vote to Republican Senator John McCain's 30.45%, a margin of 37.01%, this was still the second best performance for a Democrat in Vermont history, surpassing Lyndon B. Johnson's 1964 performance.[1]
Vermont historically was a bastion of northeastern Republicanism, voting Republican in every single election but one between 1856 and 1988, interrupted only in 1964. It also elected solely Republican governors from 1854 to 1962 and solely Republican Senators from 1855 to 1968. However, after migration from liberal northeastern cities such as Boston and New York to Vermont in the 1960s and 70s, it shifted sharply towards the Democratic Party with Bill Clinton's landslide victory in 1992, and has been part of the "Blue Wall" – the 19 jurisdictions, worth 238 electoral votes, that voted Democratic six times in a row from 1992 through 2012 – ever since.[2] Vermont also has one of the greenest economies in the country, with its own Clean Air Act and a state trust that buys farmland to support local farming. This, and a virtual nonexistence of party loyalty in the state, guaranteed Obama's landslide victory.[3]
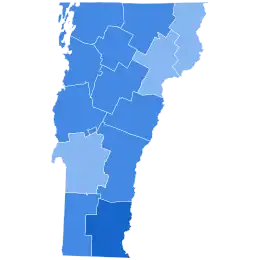
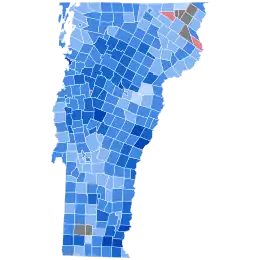
Obama's best performance was in Windham County, where he received 73.05% of the vote, though he also racked up great margins in Chittenden, Rutland, and Washington Counties, the state's three largest counties and home to Burlington, Rutland, and the state capital of Montpelier, respectively. The only county where he won by a margin of less than 20% is in Essex County in the Northeast Kingdom, generally the most conservative region in the state, where he won by 13.40%.
The results of the 2012 election made Vermont the second most Democratic state in the nation, only surpassed by the 42.71% margin in Obama's birth state of Hawaii.
As of the 2020 presidential election, this is the last time in which the Democrat won Essex County, and by extension, every county in the state.
Primaries
Democratic
The Democratic primary took place on Super Tuesday, March 6, 2012. Incumbent President Barack Obama ran unopposed. According to the Secretary of State of Vermont's office, he received 40,247 votes (97.28%) and all of the 27 delegates attending the 2012 Democratic National Convention in Charlotte, North Carolina pledged to support his re-nomination. The remaining 2.72% of the vote was made up of 675 write-ins (1.63%) and 450 blank votes (1.09%).[4]
Republican
| |||||||||||||||||||||||||||||||||||||||||
| |||||||||||||||||||||||||||||||||||||||||
 Vermont results by county
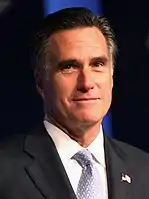
Mitt Romney | |||||||||||||||||||||||||||||||||||||||||
The Republican primary also took place on Super Tuesday, March 6, 2012.[5][6]
Vermont has 17 delegates to the 2012 Republican National Convention. Three superdelegates are bound by the primary results and awarded on a winner-take-all basis. The remaining 14 are awarded winner-take-all to the candidate who wins at least 50% of the vote statewide, or allocated proportionately among candidates winning at least 20% of the vote statewide if no one gets a majority.[7]
Former Massachusetts Governor Mitt Romney won the primary with a plurality, receiving 24,008 votes (39.45%) and 9 delegates. He won every single county. Representative from Texas's 14th district Ron Paul placed in second with 15,391 votes, or 25.29%, while former Senator from Pennsylvania Rick Santorum received 14,368 votes, or 23.61%. Both were awarded 4 delegates. The only other candidate to receive over 5% of the vote was former Speaker of the House Newt Gingrich, with 8.13% of the vote.[8]
| Vermont Republican presidential primary, March 6, 2012[9][10] | |||
|---|---|---|---|
| Candidate | Votes | Percentage | Delegates |
| 24,008 | 39.45% | 9 | |
| Ron Paul | 15,391 | 25.29% | 4 |
| Rick Santorum | 14,368 | 23.61% | 4 |
| Newt Gingrich | 4,949 | 8.13% | 0 |
| Jon Huntsman | 1,198 | 1.97% | 0 |
| Rick Perry | 544 | 0.89% | 0 |
| Write-in | 392 | 0.64% | 0 |
| Unprojected delegates: | 0 | ||
| Total: | 60,850 | 100.00% | 17 |
General election
Candidate ballot access
- Barack Obama / Joe Biden, Democratic
- Mitt Romney / Paul Ryan, Republican
- Gary Earl Johnson / James Polin Gray, Libertarian
- Rocky Anderson / Luis J. Rodriguez, Justice
- Peta Lindsay / Yari Osorio, Socialism and Liberation
The following candidates had write-in ballot access:
- Ron Paul, Republican
- Jill Stein / Cheri Honkala, Green
- Virgil Goode / Jim Clymer, Constitution
- Roseanne Barr / Cindy Sheehan, Peace and Freedom
Results
| 2012 United States presidential election in Vermont[11] | ||||||
|---|---|---|---|---|---|---|
| Party | Candidate | Running mate | Votes | Percentage | Electoral votes | |
| Democratic | Barack Obama | Joe Biden | 199,239 | 66.57% | 3 | |
| Republican | Mitt Romney | Paul Ryan | 92,698 | 30.97% | 0 | |
| Libertarian | Gary Johnson | Jim Gray | 3,487 | 1.17% | 0 | |
| Write-ins* | Write-ins | 2,043 | 0.68% | 0 | ||
| Justice | Rocky Anderson | Luis J. Rodriguez | 1,128 | 0.38% | 0 | |
| Socialism and Liberation | Peta Lindsay | Yari Osorio | 695 | 0.23% | 0 | |
| Totals | 299,290 | 100.00% | 3 | |||
- Write-ins included Ron Paul, Republican; and Jill Stein, Green.[12]
By county
| County | Barack Obama Democratic |
Mitt Romney Republican |
Various candidates Other parties |
Margin | Total votes cast | ||||
|---|---|---|---|---|---|---|---|---|---|
| # | % | # | % | # | % | # | % | ||
| Addison | 12,257 | 68.44% | 5,203 | 29.05% | 450 | 2.51% | 7,054 | 39.39% | 17,910 |
| Bennington | 11,514 | 65.45% | 5,687 | 32.33% | 392 | 2.22% | 5,827 | 33.12% | 17,593 |
| Caledonia | 8,192 | 59.97% | 5,088 | 37.24% | 381 | 2.79% | 3,104 | 22.73% | 13,661 |
| Chittenden | 53,626 | 69.57% | 21,571 | 27.99% | 1,883 | 2.44% | 32,055 | 41.58% | 77,080 |
| Essex | 1,539 | 55.00% | 1,164 | 41.60% | 95 | 3.40% | 375 | 13.40% | 2,798 |
| Franklin | 12,057 | 60.62% | 7,405 | 37.23% | 426 | 2.15% | 4,652 | 23.39% | 19,888 |
| Grand Isle | 2,531 | 62.11% | 1,471 | 36.10% | 73 | 1.79% | 1,060 | 26.01% | 4,075 |
| Lamoille | 8,371 | 69.83% | 3,342 | 27.88% | 275 | 2.29% | 5,029 | 41.95% | 11,988 |
| Orange | 9,076 | 64.58% | 4,588 | 32.65% | 389 | 2.77% | 4,488 | 31.93% | 14,053 |
| Orleans | 7,117 | 60.87% | 4,306 | 36.83% | 269 | 2.30% | 2,811 | 24.04% | 11,692 |
| Rutland | 17,088 | 59.73% | 10,835 | 37.87% | 686 | 2.40% | 6,253 | 21.86% | 28,609 |
| Washington | 20,351 | 69.44% | 8,093 | 27.61% | 863 | 2.95% | 12,258 | 41.83% | 29,307 |
| Windham | 16,026 | 73.05% | 5,347 | 24.37% | 564 | 2.58% | 10,679 | 48.68% | 21,937 |
| Windsor | 19,494 | 67.93% | 8,598 | 29.96% | 607 | 2.11% | 10,896 | 37.97% | 28,699 |
| Totals | 199,239 | 66.57% | 92,698 | 30.97% | 7,353 | 2.46% | 106,541 | 35.60% | 299,290 |
2012 U.S. presidential election | |
|---|---|
| Democratic Party | |
| Republican Party | |
| Related races | |
| |
By congressional district
Due to the state's low population, only one congressional district is allocated. This district, called the At-Large district because it covers the entire state, is thus equivalent to the statewide election results.
| District | Romney | Obama | Representative |
|---|---|---|---|
| At-large | 30.97% | 66.57% | Peter Welch |
See also
References
- "Vermont Presidential Election Voting History". 270toWin. Retrieved December 4, 2020.
- Moskowitz, Seth (January 20, 2020). "The Road to 270: Vermont". 270toWin. Retrieved December 4, 2020.
- Cohen, Micah (October 1, 2012). "'New' Vermont Is Liberal, but 'Old' Vermont Is Still There". FiveThirtyEight. Retrieved December 4, 2020.
- "2012 President Democratic Primary". Vermont Elections Database. Vermont Secretary of State. March 6, 2012. Retrieved December 4, 2020.
- "Primary and Caucus Printable Calendar". CNN. Retrieved January 12, 2012.
- "Presidential Primary Dates" (PDF). Federal Election Commission. Retrieved January 23, 2012.
- Nate Silver (March 4, 2012). "Romney Could Win Majority of Super Tuesday Delegates". FiveThirtyEight. Retrieved March 5, 2012.
- "2012 President Republican Primary". Vermont Elections Database. Vermont Secretary of State. March 6, 2012. Retrieved December 4, 2020.
- Official Report of the Canvassing Committee Archived 2012-08-22 at the Wayback Machine, Retrieved March 22, 2012
- The Green Papers, January 14, 2012
- "Vermont Secretary of State". Archived from the original on September 3, 2014. Retrieved November 24, 2012.
- n/a, Jason (2013). "Our Campaigns - VT US President Race - Nov 06, 2012". ourcampaigns.com. Retrieved August 25, 2015.
External links
- The Green Papers: for Vermont
- The Green Papers: Major state elections in chronological order
- Official Results for 2012 Election in Vermont
- Primary Results from Vermont State government
.jpg.webp)

.jpg.webp)
