1844 United States presidential election in Maryland
The 1844 United States presidential election in Maryland took place between November 1 and December 4, 1844, as part of the 1844 United States presidential election. Voters chose eight representatives, or electors to the Electoral College, who voted for President and Vice President.
| ||||||||||||||||||||||||||
| ||||||||||||||||||||||||||
| ||||||||||||||||||||||||||
| Elections in Maryland |
|---|
.svg.png.webp) |
|
|
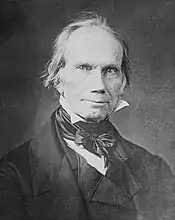
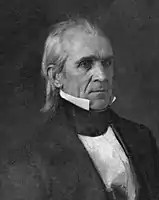
Maryland voted for the Whig candidate, Henry Clay, over Democratic candidate James K. Polk. Clay won Maryland by a margin of 4.78%.
With 52.39% of the popular vote, Maryland would prove to be Henry Clay's fifth strongest state after Rhode Island, Vermont, Kentucky and North Carolina.[1]
Results
| 1844 United States presidential election in Maryland[2] | ||||||||
|---|---|---|---|---|---|---|---|---|
| Party | Candidate | Running mate | Popular vote | Electoral vote | ||||
| Count | % | Count | % | |||||
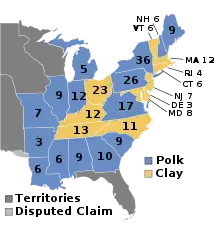
| Whig | Henry Clay of Kentucky | Theodore Frelinghuysen of New York | 35,984 | 52.39% | 8 | 100.00% | ||
| Democratic | James K. Polk of Tennessee | George M. Dallas of Pennsylvania | 32,706 | 47.61% | 0 | 0.00% | ||
| Total | 68,690 | 100.00% | 8 | 100.00% | ||||
Results by county
| County | Henry Clay
Whig |
James K. Polk
Democratic |
Margin | Total
Votes Cast [3] | |||
|---|---|---|---|---|---|---|---|
| # | % | # | % | # | % | ||
| Allegany | 1424 | 48.85% | 1491 | 51.15% | -67 | -2.30% | 2915 |
| Anne Arundel | 1777 | 54.18% | 1503 | 45.82% | 274 | 8.35% | 3280 |
| Baltimore (City and County) | 10714 | 48.01% | 11602 | 51.99% | -888 | -3.98% | 22316 |
| Calvert | 451 | 56.73% | 344 | 43.27% | 107 | 13.46% | 795 |
| Caroline | 680 | 55.19% | 552 | 44.81% | 128 | 10.39% | 1232 |
| Carroll | 1784 | 51.29% | 1694 | 48.71% | 90 | 2.59% | 3478 |
| Cecil | 1527 | 50.38% | 1504 | 49.62% | 23 | 0.76% | 3031 |
| Charles | 785 | 60.20% | 519 | 39.80% | 266 | 20.40% | 1304 |
| Dorchester | 1377 | 60.39% | 903 | 39.61% | 474 | 20.79% | 2280 |
| Frederick | 3190 | 51.58% | 2994 | 48.42% | 270 | 9.77% | 6184 |
| Harford | 1517 | 54.88% | 1247 | 45.12% | 270 | 9.77% | 2764 |
| Kent | 728 | 58.01% | 527 | 41.99% | 201 | 16.02% | 1255 |
| Montgomery | 1124 | 56.88% | 852 | 43.12% | 272 | 13.77% | 1976 |
| Prince George's | 1054 | 61.28% | 666 | 38.72% | 388 | 22.56% | 1720 |
| Queen Anne's | 749 | 50.92% | 722 | 49.08% | 27 | 1.84% | 1471 |
| St. Mary's | 783 | 62.59% | 468 | 37.41% | 315 | 25.18% | 1251 |
| Somerset | 1449 | 61.63% | 902 | 38.37% | 547 | 23.27% | 2351 |
| Talbot | 795 | 52.72% | 712 | 47.25% | 83 | 5.51% | 1507 |
| Washington | 2633 | 50.65% | 2565 | 49.35% | 68 | 1.31% | 5198 |
| Worcester | 1453 | 61.52% | 909 | 38.48% | 544 | 23.03% | 2362 |
| Total | 35,984 | 52.39% | 32,706 | 47.61% | 3,278 | 4.78% | 68,690 |
Counties that flipped from Whig to Democratic
Counties that flipped from Democratic to Whig
See also
References
- "1844 Presidential Election Statistics". Dave Leip’s Atlas of U.S. Presidential Elections. Retrieved March 5, 2018.
- "1844 Presidential General Election Results - Maryland". U.S. Election Atlas. Retrieved December 23, 2013.
- "County Project (WIP)". Google Docs. Retrieved November 1, 2022.
State and district results of the 1844 United States presidential election | ||
|---|---|---|
 | ||
This article is issued from Wikipedia. The text is licensed under Creative Commons - Attribution - Sharealike. Additional terms may apply for the media files.