1788–89 United States presidential election in Maryland
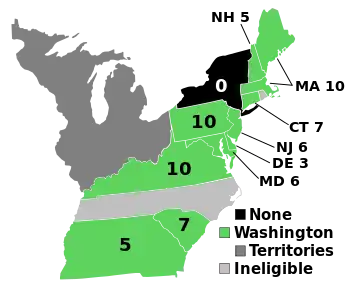
The 1788–89 United States presidential election in Maryland took place on January 7, 1789, as part of the 1788–1789 United States presidential election to elect the first President. Voters chose eight representatives, or electors to the Electoral College, who voted for President and Vice President. However, 2 electors would not vote.
| |||||||||||||||||||||||||||||||||||||||||||||||||
| |||||||||||||||||||||||||||||||||||||||||||||||||
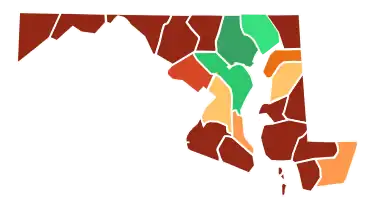
 County Results
| |||||||||||||||||||||||||||||||||||||||||||||||||
| |||||||||||||||||||||||||||||||||||||||||||||||||
| Elections in Maryland |
|---|
.svg.png.webp) |
|
|
Early elections were quite different from modern ones. Voters voted for individual electors, who were pledged to vote for certain candidates. Oftentimes, which candidate an elector intended to support was unclear.[1] Prior to the ratification of the 12th amendment, each elector did not distinguish between a vote cast for president and Vice President, and simply cast two votes.[2]
All electors were pledged to Washington, but there was a Federalist slate which supported Robert Hanson Harrison for Vice President and an Anti-Federalist slate which supported George Clinton for vice president. Additionally, there were two electors supported by both parties. Maryland chose the Federalist electors over the Anti-Federalist electors by a large margin. John Rogers, the highest elector supported by both parties, received 7,665. The highest Federalist elector, Alexander C. Hanson, received 5,596 votes. The highest Anti-Federalist elector, Jeremiah T. Chase, received 2,278 votes.[3][4]
Results
| 1788-1789 United States presidential election in Maryland | |||||
|---|---|---|---|---|---|
| Party | Candidate | Votes | Percentage | Electoral votes | |
| Independent | George Washington | 7,874 | 100% | 6 | |
| Totals | 7,874 | 100.0% | 6 | ||
Results by county
| For President | George Washington | Margin | Total Votes Cast | ||||
|---|---|---|---|---|---|---|---|
| For Vice President | Robert Harrison
Federalist |
George Clinton
Anti-Federalist | |||||
| County | # | % | # | % | # | % | |
| Anne Arundel | 246 | 30.87% | 551 | 69.13% | -305 | -38.27% | 797 |
| Baltimore (City and County) | 643 | 38.16% | 1,042 | 61.84% | -499 | -23.68% | 1,685 |
| Calvert | 168 | 62.92% | 99 | 37.08% | 69 | 25.84% | 267 |
| Caroline | 128 | 99.22% | 1 | 0.78% | 127 | 98.45% | 129 |
| Cecil | 519 | 100.00% | 0 | 0.00% | 519 | 100.00% | 519 |
| Charles | 152 | 91.02% | 15 | 8.98% | 137 | 82.04% | 167 |
| Dorchester | 114 | 62.64% | 68 | 37.36% | 46 | 25.27% | 182 |
| Frederick | 790 | 99.62% | 3 | 0.38% | 787 | 99.24% | 793 |
| Harford | 439 | 64.56% | 241 | 35.44% | 198 | 29.12% | 680 |
| Kent | 209 | 79.77% | 53 | 20.23% | 156 | 59.54% | 262 |
| Montgomery | 321 | 87.95% | 44 | 12.05% | 277 | 75.89% | 365 |
| Prince George's | 273 | 52.91% | 243 | 47.09% | 30 | 5.81% | 516 |
| Queen Anne's | 51 | 51.00% | 49 | 49.00% | 2 | 2.00% | 100 |
| St. Mary's | 100 | 71.94% | 39 | 28.06% | 61 | 43.88% | 139 |
| Somerset | 212 | 99.07% | 2 | 0.93% | 210 | 98.13% | 214 |
| Talbot | 254 | 100.00% | 0 | 0.00% | 254 | 100.00% | 254 |
| Washington | 1,164 | 100.00% | 0 | 0.00% | 1164 | 100.00% | 1,164 |
| Worcester | 154 | 66.38% | 78 | 33.62% | 76 | 32.76% | 232 |
| Total | 5,937 | 70.13% | 2,528 | 29.87% | 3,409 | 40.26% | 8,465 |
See also
References
- "A New Nation Votes". elections.lib.tufts.edu. Retrieved December 22, 2021.
- "Electoral College & Indecisive Elections | US House of Representatives: History, Art & Archives". history.house.gov. Retrieved December 22, 2021.
- "A New Nation Votes". elections.lib.tufts.edu. Retrieved December 22, 2021.
- "County Project (WIP)". Google Docs. Retrieved December 22, 2021.
- "County Project (WIP)". Google Docs. Retrieved December 22, 2021.

.jpg.webp)
.jpg.webp)
