Uxin Banner
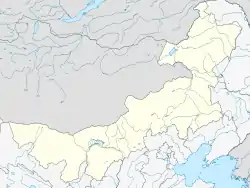
Uxin Banner (also Wushen; Mongolian: ᠦᠦᠰᠢᠨ ᠬᠣᠰᠢᠭᠤ Üüsin qosiɣu; Chinese: 乌审旗) is a banner in the southwest of Inner Mongolia, China, bounded to the south by Shaanxi province. It borders the banners of Ejin Horo to the northeast, Hanggin to the north, Otog to the northwest, and Otog Front to the southwest. It is under the administration of Ordos City.
Uxin Banner
乌审旗 • ᠦᠦᠰᠢᠨ ᠬᠣᠰᠢᠭᠤ Wushen | |
|---|---|
 Uxin Location in Inner Mongolia  Uxin Uxin (China) | |
| Coordinates: 38°35′N 108°51′E | |
| Country | China |
| Autonomous region | Inner Mongolia |
| Prefecture-level city | Ordos |
| Banner seat | Galut |
| Area | |
| • Total | 11,650 km2 (4,500 sq mi) |
| Elevation | 1,299 m (4,262 ft) |
| Population (2020)[1] | |
| • Total | 158,566 |
| • Density | 14/km2 (35/sq mi) |
| Time zone | UTC+8 (China Standard) |
| Website | www |
| Uxin Banner | |||||||
|---|---|---|---|---|---|---|---|
| Chinese name | |||||||
| Simplified Chinese | 乌审旗 | ||||||
| Traditional Chinese | 烏審旗 | ||||||
| |||||||
| Mongolian name | |||||||
| Mongolian Cyrillic | Үүшин Хошуу | ||||||
| Mongolian script | ᠦᠦᠰᠢᠨ ᠬᠣᠰᠢᠭᠤ | ||||||
| |||||||
Administrative divisions
Uxin Banner is made up of 5 towns and 1 sum.
| Name | Simplified Chinese | Hanyu Pinyin | Mongolian (Hudum Script) | Mongolian (Cyrillic) | Administrative division code |
|---|---|---|---|---|---|
| Towns | |||||
| Galut Town | 嘎鲁图镇 | Gālǔtú Zhèn | ᠭᠠᠯᠠᠭᠤᠲᠤ ᠪᠠᠯᠭᠠᠰᠤ | Галуут балгас | 150626100 |
| Uxin Ju Town | 乌审召镇 | Wūshěnzhào Zhèn | ᠦᠦᠰᠢᠨᠵᠤᠤ ᠪᠠᠯᠭᠠᠰᠤ | Үүшинжүү балгас | 150626101 |
| Tug Town | 图克镇 | Túkè Zhèn | ᠲᠤᠭ ᠪᠠᠯᠭᠠᠰᠤ | Дог балгас | 150626102 |
| Ulan Tolgoi Town | 乌兰陶勒盖镇 | Wūlántáolègài Zhèn | ᠤᠯᠠᠭᠠᠨᠲᠣᠯᠣᠭᠠᠢ ᠪᠠᠯᠭᠠᠰᠤ | Улаантолгой балгас | 150626103 |
| Wudinghe Town | 无定河镇 | Wúdìnghé Zhèn | ᠰᠢᠷᠠᠤ᠋ᠰᠤᠨ ᠪᠠᠯᠭᠠᠰᠤ | Шараосон балгас | 150626104 |
| Sum | |||||
| Suld Sum | 苏力德苏木 | Sūlìdé Sūmù | ᠰᠦᠯᠳᠡ ᠰᠤᠮᠤ | Сүлд сум | 150626200 |
Other: Subrag Economic Development Zone (苏里格经济开发区)
Climate
| Climate data for Uxin Banner (1991–2020 normals, extremes 1981–2010) | |||||||||||||
|---|---|---|---|---|---|---|---|---|---|---|---|---|---|
| Month | Jan | Feb | Mar | Apr | May | Jun | Jul | Aug | Sep | Oct | Nov | Dec | Year |
| Record high °C (°F) | 14.5 (58.1) |
18.4 (65.1) |
26.8 (80.2) |
33.6 (92.5) |
34.7 (94.5) |
37.6 (99.7) |
37.9 (100.2) |
34.7 (94.5) |
35.6 (96.1) |
28.4 (83.1) |
22.7 (72.9) |
14.3 (57.7) |
37.9 (100.2) |
| Average high °C (°F) | −1.2 (29.8) |
3.4 (38.1) |
10.1 (50.2) |
17.9 (64.2) |
23.5 (74.3) |
27.9 (82.2) |
29.3 (84.7) |
27.2 (81.0) |
22.1 (71.8) |
15.6 (60.1) |
7.5 (45.5) |
0.4 (32.7) |
15.3 (59.6) |
| Daily mean °C (°F) | −8.4 (16.9) |
−3.9 (25.0) |
3.0 (37.4) |
10.7 (51.3) |
16.7 (62.1) |
21.3 (70.3) |
23.0 (73.4) |
21.0 (69.8) |
15.6 (60.1) |
8.6 (47.5) |
0.6 (33.1) |
−6.5 (20.3) |
8.5 (47.3) |
| Average low °C (°F) | −14.0 (6.8) |
−9.7 (14.5) |
−3.0 (26.6) |
3.9 (39.0) |
9.8 (49.6) |
14.7 (58.5) |
17.3 (63.1) |
15.7 (60.3) |
10.2 (50.4) |
3.0 (37.4) |
−4.7 (23.5) |
−11.9 (10.6) |
2.6 (36.7) |
| Record low °C (°F) | −28.0 (−18.4) |
−24.8 (−12.6) |
−21.3 (−6.3) |
−10.3 (13.5) |
−2.4 (27.7) |
2.8 (37.0) |
9.7 (49.5) |
6.2 (43.2) |
−1.6 (29.1) |
−11.2 (11.8) |
−20.6 (−5.1) |
−27.1 (−16.8) |
−28.0 (−18.4) |
| Average precipitation mm (inches) | 2.1 (0.08) |
3.3 (0.13) |
8.2 (0.32) |
16.7 (0.66) |
31.8 (1.25) |
44.1 (1.74) |
85.2 (3.35) |
84.8 (3.34) |
52.2 (2.06) |
20.9 (0.82) |
9.2 (0.36) |
1.4 (0.06) |
359.9 (14.17) |
| Average precipitation days (≥ 0.1 mm) | 1.9 | 2.2 | 3.3 | 3.7 | 5.9 | 8.5 | 10.5 | 10.2 | 8.8 | 4.9 | 2.7 | 1.4 | 64 |
| Average snowy days | 3.2 | 3.3 | 2.7 | 0.9 | 0.1 | 0 | 0 | 0 | 0 | 0.5 | 2.2 | 2.5 | 15.4 |
| Average relative humidity (%) | 51 | 45 | 39 | 35 | 38 | 46 | 58 | 63 | 62 | 55 | 52 | 50 | 50 |
| Mean monthly sunshine hours | 217.6 | 210.2 | 246.3 | 262.4 | 291.7 | 284.4 | 274.2 | 250.6 | 221.7 | 238.4 | 217.3 | 210.8 | 2,925.6 |
| Percent possible sunshine | 71 | 69 | 66 | 66 | 66 | 64 | 61 | 60 | 60 | 70 | 73 | 72 | 67 |
| Source: China Meteorological Administration[2][3] | |||||||||||||
| Climate data for Wushenzhaozhen, Uxin Banner (1991–2020 normals) | |||||||||||||
|---|---|---|---|---|---|---|---|---|---|---|---|---|---|
| Month | Jan | Feb | Mar | Apr | May | Jun | Jul | Aug | Sep | Oct | Nov | Dec | Year |
| Average high °C (°F) | −2.0 (28.4) |
2.7 (36.9) |
9.5 (49.1) |
17.4 (63.3) |
23.1 (73.6) |
27.5 (81.5) |
29.0 (84.2) |
26.9 (80.4) |
21.8 (71.2) |
15.2 (59.4) |
6.9 (44.4) |
−0.4 (31.3) |
14.8 (58.6) |
| Daily mean °C (°F) | −11.0 (12.2) |
−6.0 (21.2) |
1.5 (34.7) |
9.6 (49.3) |
15.9 (60.6) |
20.6 (69.1) |
22.4 (72.3) |
20.2 (68.4) |
14.6 (58.3) |
7.2 (45.0) |
−1.3 (29.7) |
−8.8 (16.2) |
7.1 (44.8) |
| Average low °C (°F) | −18.1 (−0.6) |
−13.3 (8.1) |
−5.7 (21.7) |
1.7 (35.1) |
7.9 (46.2) |
12.9 (55.2) |
15.8 (60.4) |
14.2 (57.6) |
8.4 (47.1) |
0.6 (33.1) |
−7.6 (18.3) |
−15.5 (4.1) |
0.1 (32.2) |
| Average precipitation mm (inches) | 2.1 (0.08) |
3.1 (0.12) |
8.3 (0.33) |
14.9 (0.59) |
28.9 (1.14) |
40.3 (1.59) |
87.8 (3.46) |
88.6 (3.49) |
43.6 (1.72) |
18.5 (0.73) |
7.8 (0.31) |
1.8 (0.07) |
345.7 (13.63) |
| Average precipitation days (≥ 0.1 mm) | 1.7 | 2.1 | 3.2 | 3.4 | 5.9 | 8.0 | 11.1 | 10.2 | 9.0 | 4.7 | 2.5 | 1.5 | 63.3 |
| Average snowy days | 2.3 | 3.0 | 2.7 | 1.0 | 0 | 0 | 0 | 0 | 0 | 0.6 | 1.8 | 2.2 | 13.6 |
| Average relative humidity (%) | 56 | 49 | 41 | 36 | 39 | 48 | 60 | 66 | 65 | 58 | 56 | 55 | 52 |
| Mean monthly sunshine hours | 227.8 | 220.5 | 259.2 | 279.0 | 308.7 | 301.3 | 293.9 | 270.5 | 240.7 | 247.1 | 225.3 | 220.8 | 3,094.8 |
| Percent possible sunshine | 75 | 72 | 69 | 70 | 69 | 68 | 65 | 65 | 65 | 72 | 76 | 76 | 70 |
| Source: China Meteorological Administration[2][4] | |||||||||||||
| Climate data for Henanxiang, Uxin Banner (1991–2020 normals) | |||||||||||||
|---|---|---|---|---|---|---|---|---|---|---|---|---|---|
| Month | Jan | Feb | Mar | Apr | May | Jun | Jul | Aug | Sep | Oct | Nov | Dec | Year |
| Average high °C (°F) | −0.2 (31.6) |
4.7 (40.5) |
11.5 (52.7) |
19.0 (66.2) |
24.3 (75.7) |
28.3 (82.9) |
29.5 (85.1) |
27.4 (81.3) |
22.8 (73.0) |
16.7 (62.1) |
9.1 (48.4) |
1.7 (35.1) |
16.2 (61.2) |
| Daily mean °C (°F) | −10.1 (13.8) |
−4.7 (23.5) |
2.9 (37.2) |
10.7 (51.3) |
16.7 (62.1) |
21.1 (70.0) |
22.6 (72.7) |
20.6 (69.1) |
15.2 (59.4) |
8.0 (46.4) |
−0.1 (31.8) |
−7.8 (18.0) |
7.9 (46.3) |
| Average low °C (°F) | −17.7 (0.1) |
−12.3 (9.9) |
−4.8 (23.4) |
2.2 (36.0) |
8.2 (46.8) |
13.0 (55.4) |
15.9 (60.6) |
14.4 (57.9) |
8.7 (47.7) |
1.1 (34.0) |
−6.7 (19.9) |
−14.8 (5.4) |
0.6 (33.1) |
| Average precipitation mm (inches) | 2.5 (0.10) |
3.1 (0.12) |
8.6 (0.34) |
19.4 (0.76) |
28.6 (1.13) |
41.1 (1.62) |
72.3 (2.85) |
79.7 (3.14) |
54.9 (2.16) |
22.7 (0.89) |
10.0 (0.39) |
1.7 (0.07) |
344.6 (13.57) |
| Average precipitation days (≥ 0.1 mm) | 2.2 | 2.1 | 3.3 | 4.4 | 5.6 | 7.8 | 10.0 | 9.8 | 8.9 | 5.8 | 2.8 | 1.5 | 64.2 |
| Average snowy days | 3.2 | 2.8 | 2.0 | 0.7 | 0 | 0 | 0 | 0 | 0 | 0.6 | 1.9 | 2.1 | 13.3 |
| Average relative humidity (%) | 59 | 52 | 46 | 43 | 45 | 52 | 64 | 71 | 71 | 65 | 62 | 59 | 57 |
| Mean monthly sunshine hours | 214.5 | 199.9 | 234.9 | 252.9 | 275.1 | 272.9 | 265.5 | 247.1 | 214.2 | 225.1 | 212.9 | 207.9 | 2,822.9 |
| Percent possible sunshine | 70 | 65 | 63 | 64 | 62 | 62 | 60 | 59 | 58 | 66 | 71 | 70 | 64 |
| Source: China Meteorological Administration[2][5] | |||||||||||||
References
- Inner Mongolia: Prefectures, Cities, Districts and Counties
- 中国气象数据网 – WeatherBk Data (in Simplified Chinese). China Meteorological Administration. Retrieved 10 October 2023.
- 中国气象数据网 (in Simplified Chinese). China Meteorological Administration. Retrieved 10 October 2023.
- 中国气象数据网 (in Simplified Chinese). China Meteorological Administration. Retrieved 10 October 2023.
- 中国气象数据网 (in Simplified Chinese). China Meteorological Administration. Retrieved 10 October 2023.
- www.xzqh.org (in Chinese)
This article is issued from Wikipedia. The text is licensed under Creative Commons - Attribution - Sharealike. Additional terms may apply for the media files.