1992 United States presidential election in Montana
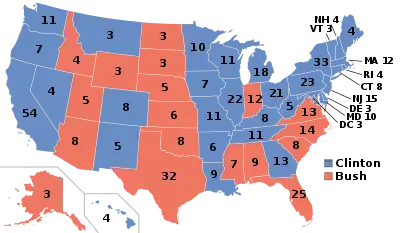
The 1992 United States presidential election in Montana was held on November 3, 1992 as part of the 1992 United States presidential election. Voters chose three representatives, or electors to the Electoral College, who voted for president and vice president.
| |||||||||||||||||||||||||||||||||
| |||||||||||||||||||||||||||||||||
 County Results[1]
| |||||||||||||||||||||||||||||||||
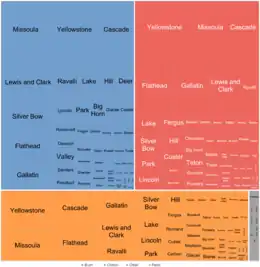
 Results by county showing number of votes by size and candidates by color.[2] | |||||||||||||||||||||||||||||||||
| |||||||||||||||||||||||||||||||||
| Elections in Montana |
|---|
 |
Montana was won by Governor Bill Clinton (D-Arkansas) with a 37.63% plurality of the popular vote over incumbent President George H. W. Bush's (R-Texas) 35.12%, and businessman Ross Perot's (I-Texas) 26.12%.[3][4] As of 2020, this is the last time Montana voted for the Democratic candidate and is currently the only time a Democratic presidential nominee has carried the state since 1964, setting it apart from its neighboring states (Wyoming, Idaho, North Dakota, and South Dakota), all of which have maintained their Republican streak since 1964. Similarly, this marks the second of two times that Montana has voted for a different candidate than neighboring Idaho, the first being 1892, both states' first election since statehood. This was also one of eight states where Perot earned over 25 percent of the vote.
Since 1964, Montana has only been competitive in a handful of elections: besides this one, the only elections in which a Democrat came within 5% of carrying the state were in the subsequent election, and in Barack Obama's first election in 2008.
Results
| 1992 United States presidential election in Montana[3] | |||||
|---|---|---|---|---|---|
| Party | Candidate | Votes | Percentage | Electoral votes | |
| Democratic | Bill Clinton | 154,507 | 37.63% | 3 | |
| Republican | George H. W. Bush (incumbent) | 144,207 | 35.12% | 0 | |
| Independent | Ross Perot | 107,225 | 26.12% | 0 | |
| America First | James "Bo" Gritz | 3,658 | 0.89% | 0 | |
| Libertarian | Andre Marrou | 986 | 0.24% | 0 | |
| Totals | 410,583 | 100.00% | 3 | ||
By county
Official results by county from the Montana Secretary of State.[2]
| County | Candidate | Total | ||||
|---|---|---|---|---|---|---|
| Clinton | Bush | Perot | (other) | |||
| Beaverhead | votes | 1,098 | 1,746 | 1,202 | 114 | 4,160 |
| percent | 26.39% | 41.97% | 28.89% | 2.74% | 100.00% | |
| Big Horn | votes | 2,154 | 1,377 | 840 | 23 | 4,394 |
| percent | 49.02% | 31.34% | 19.12% | 0.52% | 100.00% | |
| Blaine | votes | 1,355 | 971 | 699 | 21 | 3,046 |
| percent | 44.48% | 31.88% | 22.95% | 0.69% | 100.00% | |
| Broadwater | votes | 491 | 830 | 505 | 16 | 1,842 |
| percent | 26.66% | 45.06% | 27.42% | 0.87% | 100.00% | |
| Carbon | votes | 1,549 | 1,562 | 1,482 | 27 | 4,620 |
| percent | 33.53% | 33.81% | 32.08% | 0.58% | 100.00% | |
| Carter | votes | 154 | 497 | 220 | 3 | 874 |
| percent | 17.62% | 56.86% | 25.17% | 0.34% | 100.00% | |
| Cascade | votes | 14,719 | 12,494 | 9,151 | 214 | 36,578 |
| percent | 40.24% | 34.16% | 25.02% | 0.59% | 100.00% | |
| Chouteau | votes | 959 | 1,380 | 870 | 27 | 3,236 |
| percent | 29.64% | 42.65% | 26.89% | 0.83% | 100.00% | |
| Custer | votes | 1,968 | 2,105 | 1,505 | 33 | 5,611 |
| percent | 35.07% | 37.52% | 26.82% | 0.59% | 100.00% | |
| Daniels | votes | 457 | 496 | 402 | 8 | 1,363 |
| percent | 33.53% | 36.39% | 29.49% | 0.59% | 100.00% | |
| Dawson | votes | 1,785 | 1,679 | 1,370 | 16 | 4,850 |
| percent | 36.80% | 34.62% | 28.25% | 0.33% | 100.00% | |
| Deer Lodge | votes | 3,174 | 832 | 1,207 | 56 | 5,269 |
| percent | 60.24% | 15.79% | 22.91% | 1.06% | 100.00% | |
| Fallon | votes | 446 | 731 | 427 | 4 | 1,608 |
| percent | 27.74% | 45.46% | 26.55% | 0.25% | 100.00% | |
| Fergus | votes | 1,615 | 2,736 | 1,934 | 205 | 6,490 |
| percent | 24.88% | 42.16% | 29.80% | 3.16% | 100.00% | |
| Flathead | votes | 9,746 | 11,699 | 9,109 | 862 | 31,416 |
| percent | 31.02% | 37.24% | 28.99% | 2.74% | 100.00% | |
| Gallatin | votes | 9,535 | 11,109 | 7,711 | 424 | 28,779 |
| percent | 33.13% | 38.60% | 26.79% | 1.47% | 100.00% | |
| Garfield | votes | 125 | 403 | 281 | 10 | 819 |
| percent | 15.26% | 49.21% | 34.31% | 1.22% | 100.00% | |
| Glacier | votes | 2,076 | 1,222 | 997 | 28 | 4,323 |
| percent | 48.02% | 28.27% | 23.06% | 0.65% | 100.00% | |
| Golden Valley | votes | 142 | 192 | 157 | 5 | 496 |
| percent | 28.63% | 38.71% | 31.65% | 1.01% | 100.00% | |
| Granite | votes | 358 | 556 | 386 | 22 | 1,322 |
| percent | 27.08% | 42.06% | 29.20% | 1.66% | 100.00% | |
| Hill | votes | 3,618 | 2,408 | 2,017 | 39 | 8,082 |
| percent | 44.77% | 29.79% | 24.96% | 0.48% | 100.00% | |
| Jefferson | votes | 1,415 | 1,541 | 1,172 | 97 | 4,225 |
| percent | 33.49% | 36.47% | 27.74% | 2.30% | 100.00% | |
| Judith Basin | votes | 409 | 610 | 415 | 13 | 1,447 |
| percent | 28.27% | 42.16% | 28.68% | 0.90% | 100.00% | |
| Lake | votes | 3,938 | 3,596 | 2,878 | 140 | 10,552 |
| percent | 37.32% | 34.08% | 27.27% | 1.33% | 100.00% | |
| Lewis and Clark | votes | 11,117 | 9,351 | 5,560 | 151 | 26,179 |
| percent | 42.47% | 35.72% | 21.24% | 0.58% | 100.00% | |
| Liberty | votes | 321 | 512 | 363 | 15 | 1,211 |
| percent | 26.51% | 42.28% | 29.98% | 1.24% | 100.00% | |
| Lincoln | votes | 2,765 | 2,799 | 2,637 | 177 | 8,378 |
| percent | 33.00% | 33.41% | 31.48% | 2.11% | 100.00% | |
| Madison | votes | 779 | 1,415 | 1,043 | 62 | 3,299 |
| percent | 23.61% | 42.89% | 31.62% | 1.88% | 100.00% | |
| McCone | votes | 424 | 528 | 395 | 7 | 1,354 |
| percent | 31.31% | 39.00% | 29.17% | 0.52% | 100.00% | |
| Meagher | votes | 260 | 422 | 310 | 10 | 1,002 |
| percent | 25.95% | 42.12% | 30.94% | 1.00% | 100.00% | |
| Mineral | votes | 664 | 403 | 543 | 25 | 1,635 |
| percent | 40.61% | 24.65% | 33.21% | 1.53% | 100.00% | |
| Missoula | votes | 20,347 | 12,898 | 9,735 | 319 | 43,299 |
| percent | 46.99% | 29.79% | 22.48% | 0.74% | 100.00% | |
| Musselshell | votes | 648 | 876 | 691 | 13 | 2,228 |
| percent | 29.08% | 39.32% | 31.01% | 0.58% | 100.00% | |
| Park | votes | 2,258 | 2,846 | 2,182 | 196 | 7,482 |
| percent | 30.18% | 38.04% | 29.16% | 2.62% | 100.00% | |
| Petroleum | votes | 61 | 135 | 95 | 5 | 296 |
| percent | 20.61% | 45.61% | 32.09% | 1.69% | 100.00% | |
| Phillips | votes | 634 | 1,026 | 949 | 16 | 2,625 |
| percent | 24.15% | 39.09% | 36.15% | 0.61% | 100.00% | |
| Pondera | votes | 1,046 | 1,252 | 855 | 12 | 3,165 |
| percent | 33.05% | 39.56% | 27.01% | 0.38% | 100.00% | |
| Powder River | votes | 258 | 547 | 340 | 11 | 1,156 |
| percent | 22.32% | 47.32% | 29.41% | 0.95% | 100.00% | |
| Powell | votes | 989 | 1,058 | 872 | 19 | 2,938 |
| percent | 33.66% | 36.01% | 29.68% | 0.65% | 100.00% | |
| Prairie | votes | 260 | 412 | 179 | 5 | 856 |
| percent | 30.37% | 48.13% | 20.91% | 0.58% | 100.00% | |
| Ravalli | votes | 4,644 | 5,392 | 4,573 | 410 | 15,019 |
| percent | 30.92% | 35.90% | 30.45% | 2.73% | 100.00% | |
| Richland | votes | 1,440 | 1,760 | 1,525 | 23 | 4,748 |
| percent | 30.33% | 37.07% | 32.12% | 0.48% | 100.00% | |
| Roosevelt | votes | 1,827 | 1,212 | 1,089 | 65 | 4,193 |
| percent | 43.57% | 28.91% | 25.97% | 1.55% | 100.00% | |
| Rosebud | votes | 1,669 | 1,130 | 1,099 | 20 | 3,918 |
| percent | 42.60% | 28.84% | 28.05% | 0.51% | 100.00% | |
| Sanders | votes | 1,689 | 1,361 | 1,378 | 78 | 4,506 |
| percent | 37.48% | 30.20% | 30.58% | 1.73% | 100.00% | |
| Sheridan | votes | 1,077 | 795 | 782 | 9 | 2,663 |
| percent | 40.44% | 29.85% | 29.37% | 0.34% | 100.00% | |
| Silver Bow | votes | 9,960 | 3,491 | 4,570 | 125 | 18,146 |
| percent | 54.89% | 19.24% | 25.18% | 0.69% | 100.00% | |
| Stillwater | votes | 1,178 | 1,390 | 1,056 | 16 | 3,640 |
| percent | 32.36% | 38.19% | 29.01% | 0.44% | 100.00% | |
| Sweet Grass | votes | 395 | 880 | 507 | 19 | 1,801 |
| percent | 21.93% | 48.86% | 28.15% | 1.05% | 100.00% | |
| Teton | votes | 1,043 | 1,364 | 969 | 29 | 3,405 |
| percent | 30.63% | 40.06% | 28.46% | 0.85% | 100.00% | |
| Toole | votes | 854 | 943 | 903 | 17 | 2,717 |
| percent | 31.43% | 34.71% | 33.24% | 0.63% | 100.00% | |
| Treasure | votes | 157 | 206 | 178 | 6 | 547 |
| percent | 28.70% | 37.66% | 32.54% | 1.10% | 100.00% | |
| Valley | votes | 1,715 | 1,497 | 1,320 | 36 | 4,568 |
| percent | 37.54% | 32.77% | 28.90% | 0.79% | 100.00% | |
| Wheatland | votes | 384 | 478 | 284 | 4 | 1,150 |
| percent | 33.39% | 41.57% | 24.70% | 0.35% | 100.00% | |
| Wibaux | votes | 195 | 234 | 173 | 5 | 607 |
| percent | 32.13% | 38.55% | 28.50% | 0.82% | 100.00% | |
| Yellowstone | votes | 20,163 | 22,822 | 13,133 | 332 | 56,450 |
| percent | 35.72% | 40.43% | 23.26% | 0.59% | 100.00% | |
| Total | votes | 154,507 | 144,207 | 107,225 | 4,644 | 410,583 |
| percent | 37.63% | 35.12% | 26.12% | 1.13% | 100.00% | |
Counties that flipped from Democratic to Republican
Analysis
Montana was won by Governor Bill Clinton (D-Arkansas) with 37.63% of the popular vote over incumbent President George H. W. Bush (R-Texas) with 35.12%. Businessman Ross Perot (I-Texas) finished in third, with 26.12% of the popular vote.[3] It was the first time the state voted for a Democrat since it was won by President Lyndon B. Johnson in 1964. It is also the last time that the state voted Democratic (as of the 2020 presidential election), as well as the last time that Sanders County and Valley County voted Democratic. Clinton became the first ever Democrat to win the White House without carrying Lincoln or McCone Counties, as well as the first since Franklin D. Roosevelt in 1944 to win without carrying Wibaux County.
References
- "Dave Leip's Atlas of U.S. Presidential Elections".
- Cooney, Mike (1992), Official 1992 General Election Canvass, Secretary of State of Montana, archived at Montana State Library
- "1992 Presidential General Election Results - Montana". U.S. Election Atlas. Retrieved June 8, 2012.
- "1992 Presidential General Election Results". U.S. Election Atlas. Retrieved June 8, 2012.

.jpg.webp)


