1992 United States presidential election in Oklahoma
The 1992 United States presidential election in Oklahoma took place on November 3, 1992, as part of the 1992 United States presidential election. Voters chose eight representatives, or electors to the Electoral College, who voted for president and vice president.
| |||||||||||||||||||||||||||||||||
| |||||||||||||||||||||||||||||||||
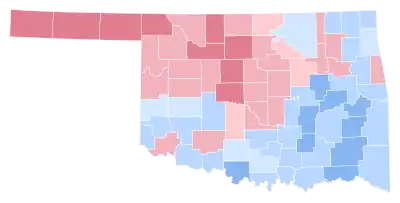 County Results
| |||||||||||||||||||||||||||||||||
| |||||||||||||||||||||||||||||||||
| Elections in Oklahoma |
|---|
 |
|
|
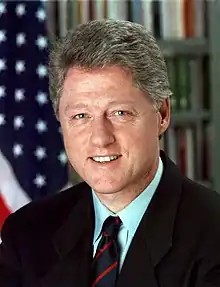
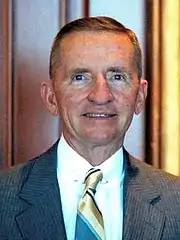
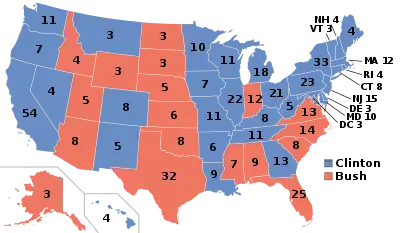
Oklahoma was won by incumbent President George H. W. Bush (R-Texas) with 42.65 percent of the popular vote over Governor Bill Clinton (D-Arkansas) with 34.02 percent. Businessman Ross Perot (I-Texas) finished in third, with 23.01 percent of the popular vote.[1] Clinton ultimately won the national vote, defeating both incumbent President Bush and Perot.[2] As of the 2020 presidential election, this is the last election in which Beckham County, Delaware County, Washita County, and Stephens County voted for a Democratic presidential candidate.[3] This was the first time that the Democrats won the White House without Jackson County and the first time since Oklahoma statehood that a losing Republican managed to carry any of the 10 counties bordering the Red River. This is the most recent time that a Democrat has carried a majority of Oklahoma's counties in a presidential election.
Results
| 1992 United States presidential election in Oklahoma[1] | |||||
|---|---|---|---|---|---|
| Party | Candidate | Votes | Percentage | Electoral votes | |
| Republican | George H. W. Bush (incumbent) | 592,929 | 42.65% | 8 | |
| Democratic | Bill Clinton | 473,066 | 34.02% | 0 | |
| Independent | Ross Perot | 319,878 | 23.01% | 0 | |
| Libertarian | Andre Marrou | 4,486 | 0.32% | 0 | |
| Totals | 1,390,359 | 100.0% | 8 | ||
| Voter turnout (Voting age/Registered Voters) | 60%/60% | ||||
Results by county
| County | George Herbert Walker Bush Republican |
William Jefferson Clinton Democratic |
Henry Ross Perot Independent |
Andre Verne Marrou Libertarian |
Margin | Total votes cast | |||||
|---|---|---|---|---|---|---|---|---|---|---|---|
| # | % | # | % | # | % | # | % | # | % | ||
| Adair | 2,994 | 45.48% | 2,645 | 40.18% | 914 | 13.88% | 30 | 0.46% | 349 | 5.30% | 6,583 |
| Alfalfa | 1,567 | 51.46% | 741 | 24.33% | 722 | 23.71% | 15 | 0.49% | 826 | 27.13% | 3,045 |
| Atoka | 1,561 | 30.21% | 2,336 | 45.21% | 1,255 | 24.29% | 15 | 0.29% | -775 | -15.00% | 5,167 |
| Beaver | 1,699 | 59.61% | 580 | 20.35% | 565 | 19.82% | 6 | 0.21% | 1,119 | 39.26% | 2,850 |
| Beckham | 2,913 | 37.25% | 2,947 | 37.69% | 1,929 | 24.67% | 31 | 0.40% | -34 | -0.43% | 7,820 |
| Blaine | 2,209 | 43.73% | 1,564 | 30.96% | 1,258 | 24.90% | 21 | 0.42% | 645 | 12.77% | 5,052 |
| Bryan | 3,452 | 25.63% | 6,259 | 46.47% | 3,713 | 27.57% | 44 | 0.33% | 2,546[lower-alpha 1] | 18.90% | 13,468 |
| Caddo | 3,664 | 31.89% | 4,861 | 42.31% | 2,911 | 25.34% | 52 | 0.45% | -1,197 | -10.42% | 11,488 |
| Canadian | 16,756 | 50.70% | 7,215 | 21.83% | 8,985 | 27.19% | 94 | 0.28% | 7,771[lower-alpha 2] | 23.51% | 33,050 |
| Carter | 5,947 | 32.38% | 7,171 | 39.04% | 5,188 | 28.24% | 62 | 0.34% | -1,224 | -6.66% | 18,368 |
| Cherokee | 4,977 | 32.94% | 6,794 | 44.96% | 3,297 | 21.82% | 43 | 0.28% | -1,817 | -12.02% | 15,111 |
| Choctaw | 1,641 | 25.73% | 3,413 | 53.52% | 1,298 | 20.35% | 25 | 0.39% | -1,772 | -27.79% | 6,377 |
| Cimarron | 965 | 59.42% | 395 | 24.32% | 254 | 15.64% | 10 | 0.62% | 570 | 35.10% | 1,624 |
| Cleveland | 35,561 | 44.10% | 24,404 | 30.27% | 20,352 | 25.24% | 312 | 0.39% | 11,157 | 13.84% | 80,629 |
| Coal | 714 | 25.50% | 1,448 | 51.71% | 618 | 22.07% | 20 | 0.71% | -734 | -26.21% | 2,800 |
| Comanche | 15,704 | 44.21% | 12,237 | 34.45% | 7,463 | 21.01% | 116 | 0.33% | 3,467 | 9.76% | 35,520 |
| Cotton | 910 | 29.44% | 1,314 | 42.51% | 853 | 27.60% | 14 | 0.45% | -404 | -13.07% | 3,091 |
| Craig | 2,106 | 33.86% | 2,780 | 44.70% | 1,316 | 21.16% | 17 | 0.27% | -674 | -10.84% | 6,219 |
| Creek | 10,055 | 39.84% | 9,118 | 36.13% | 5,984 | 23.71% | 81 | 0.32% | 937 | 3.71% | 25,238 |
| Custer | 5,362 | 45.85% | 3,540 | 30.27% | 2,741 | 23.44% | 51 | 0.44% | 1,822 | 15.58% | 11,694 |
| Delaware | 4,840 | 38.95% | 4,842 | 38.97% | 2,689 | 21.64% | 55 | 0.44% | -2 | -0.02% | 12,426 |
| Dewey | 1,244 | 44.72% | 845 | 30.37% | 684 | 24.59% | 9 | 0.32% | 399 | 14.34% | 2,782 |
| Ellis | 1,072 | 46.47% | 594 | 25.75% | 632 | 27.39% | 9 | 0.39% | 440[lower-alpha 2] | 19.07% | 2,307 |
| Garfield | 13,095 | 51.38% | 6,720 | 26.37% | 5,559 | 21.81% | 111 | 0.44% | 6,375 | 25.01% | 25,485 |
| Garvin | 3,983 | 33.57% | 4,811 | 40.55% | 3,014 | 25.41% | 55 | 0.46% | -828 | -6.98% | 11,863 |
| Grady | 6,997 | 39.40% | 6,177 | 34.79% | 4,528 | 25.50% | 55 | 0.31% | 820 | 4.62% | 17,757 |
| Grant | 1,311 | 42.90% | 864 | 28.27% | 871 | 28.50% | 10 | 0.33% | 440[lower-alpha 2] | 14.40% | 3,056 |
| Greer | 964 | 34.69% | 1,162 | 41.81% | 640 | 23.03% | 13 | 0.47% | -198 | -7.12% | 2,779 |
| Harmon | 496 | 30.79% | 783 | 48.60% | 326 | 20.24% | 6 | 0.37% | -287 | -17.82% | 1,611 |
| Harper | 1,038 | 51.01% | 486 | 23.88% | 501 | 24.62% | 10 | 0.49% | 537[lower-alpha 2] | 26.39% | 2,035 |
| Haskell | 1,461 | 26.34% | 3,069 | 55.34% | 995 | 17.94% | 21 | 0.38% | -1,608 | -28.99% | 5,546 |
| Hughes | 1,522 | 27.40% | 2,850 | 51.31% | 1,158 | 20.85% | 24 | 0.43% | -1,328 | -23.91% | 5,554 |
| Jackson | 3,893 | 41.33% | 3,273 | 34.75% | 2,227 | 23.64% | 27 | 0.29% | 620 | 6.58% | 9,420 |
| Jefferson | 671 | 22.23% | 1,580 | 52.34% | 758 | 25.11% | 10 | 0.33% | 822[lower-alpha 1] | 27.23% | 3,019 |
| Johnston | 1,191 | 27.45% | 2,096 | 48.31% | 1,040 | 23.97% | 12 | 0.28% | -905 | -20.86% | 4,339 |
| Kay | 9,115 | 39.93% | 6,643 | 29.10% | 6,984 | 30.59% | 86 | 0.38% | 2,131[lower-alpha 2] | 9.34% | 22,828 |
| Kingfisher | 3,479 | 54.27% | 1,379 | 21.51% | 1,534 | 23.93% | 19 | 0.30% | 1,945[lower-alpha 2] | 30.34% | 6,411 |
| Kiowa | 1,635 | 33.30% | 2,143 | 43.65% | 1,114 | 22.69% | 18 | 0.37% | -508 | -10.35% | 4,910 |
| Latimer | 1,212 | 24.81% | 2,606 | 53.35% | 1,049 | 21.47% | 18 | 0.37% | -1,394 | -28.54% | 4,885 |
| Le Flore | 5,850 | 34.90% | 7,843 | 46.79% | 3,021 | 18.02% | 49 | 0.29% | -1,993 | -11.89% | 16,763 |
| Lincoln | 5,315 | 42.78% | 3,904 | 31.43% | 3,160 | 25.44% | 44 | 0.35% | 1,411 | 11.36% | 12,423 |
| Logan | 6,071 | 43.97% | 4,453 | 32.25% | 3,239 | 23.46% | 43 | 0.31% | 1,618 | 11.72% | 13,806 |
| Love | 922 | 25.06% | 1,708 | 46.43% | 1,033 | 28.08% | 16 | 0.43% | 675[lower-alpha 1] | 18.35% | 3,679 |
| McClain | 4,377 | 40.62% | 3,378 | 31.35% | 2,996 | 27.80% | 25 | 0.23% | 999 | 9.27% | 10,776 |
| McCurtain | 3,519 | 30.62% | 5,082 | 44.21% | 2,852 | 24.81% | 41 | 0.36% | -1,563 | -13.60% | 11,494 |
| McIntosh | 2,225 | 28.19% | 4,184 | 53.01% | 1,469 | 18.61% | 15 | 0.19% | -1,959 | -24.82% | 7,893 |
| Major | 2,154 | 57.36% | 731 | 19.47% | 857 | 22.82% | 13 | 0.35% | 1,297[lower-alpha 2] | 34.54% | 3,755 |
| Marshall | 1,478 | 26.88% | 2,519 | 45.82% | 1,486 | 27.03% | 15 | 0.27% | 1,033[lower-alpha 1] | 18.79% | 5,498 |
| Mayes | 5,445 | 35.89% | 6,432 | 42.40% | 3,235 | 21.32% | 59 | 0.39% | -987 | -6.51% | 15,171 |
| Murray | 1,536 | 27.49% | 2,594 | 46.42% | 1,447 | 25.89% | 11 | 0.20% | -1,058 | -18.93% | 5,588 |
| Muskogee | 8,782 | 31.44% | 13,619 | 48.76% | 5,454 | 19.53% | 77 | 0.28% | -4,837 | -17.32% | 27,932 |
| Noble | 2,474 | 46.83% | 1,333 | 25.23% | 1,449 | 27.43% | 27 | 0.51% | 1,025[lower-alpha 2] | 19.40% | 5,283 |
| Nowata | 1,531 | 33.84% | 1,912 | 42.26% | 1,063 | 23.50% | 18 | 0.40% | -381 | -8.42% | 4,524 |
| Okfuskee | 1,580 | 34.13% | 2,141 | 46.24% | 889 | 19.20% | 20 | 0.43% | -561 | -12.12% | 4,630 |
| Oklahoma | 126,788 | 48.78% | 76,271 | 29.34% | 56,139 | 21.60% | 725 | 0.28% | 50,517 | 19.44% | 259,923 |
| Okmulgee | 4,586 | 29.74% | 7,767 | 50.37% | 3,013 | 19.54% | 55 | 0.36% | -3,181 | -20.63% | 15,421 |
| Osage | 5,891 | 34.01% | 6,894 | 39.80% | 4,477 | 25.85% | 60 | 0.35% | -1,003 | -5.79% | 17,322 |
| Ottawa | 4,141 | 31.35% | 6,304 | 47.73% | 2,721 | 20.60% | 43 | 0.33% | -2,163 | -16.38% | 13,209 |
| Pawnee | 2,675 | 38.36% | 2,612 | 37.46% | 1,656 | 23.75% | 30 | 0.43% | 63 | 0.90% | 6,973 |
| Payne | 13,032 | 42.20% | 9,886 | 32.01% | 7,852 | 25.43% | 110 | 0.36% | 3,146 | 10.19% | 30,880 |
| Pittsburg | 5,659 | 30.06% | 8,523 | 45.27% | 4,594 | 24.40% | 51 | 0.27% | -2,864 | -15.21% | 18,827 |
| Pontotoc | 5,206 | 33.54% | 6,350 | 40.91% | 3,916 | 25.23% | 49 | 0.32% | -1,144 | -7.37% | 15,521 |
| Pottawatomie | 10,350 | 40.47% | 8,616 | 33.69% | 6,520 | 25.50% | 86 | 0.34% | 1,734 | 6.78% | 25,572 |
| Pushmataha | 1,319 | 26.93% | 2,553 | 52.13% | 1,000 | 20.42% | 25 | 0.51% | -1,234 | -25.20% | 4,897 |
| Roger Mills | 890 | 40.96% | 767 | 35.30% | 505 | 23.24% | 11 | 0.51% | 123 | 5.66% | 2,173 |
| Rogers | 12,455 | 44.65% | 8,257 | 29.60% | 7,101 | 25.46% | 79 | 0.28% | 4,198 | 15.05% | 27,892 |
| Seminole | 3,253 | 31.77% | 4,624 | 45.16% | 2,330 | 22.75% | 33 | 0.32% | -1,371 | -13.39% | 10,240 |
| Sequoyah | 4,925 | 36.33% | 6,092 | 44.94% | 2,486 | 18.34% | 53 | 0.39% | -1,167 | -8.61% | 13,556 |
| Stephens | 7,085 | 34.61% | 7,644 | 37.34% | 5,692 | 27.81% | 50 | 0.24% | -559 | -2.73% | 20,471 |
| Texas | 4,059 | 58.15% | 1,487 | 21.30% | 1,417 | 20.30% | 17 | 0.24% | 2,572 | 36.85% | 6,980 |
| Tillman | 1,377 | 32.96% | 1,749 | 41.86% | 1,039 | 24.87% | 13 | 0.31% | -372 | -8.90% | 4,178 |
| Tulsa | 117,465 | 49.13% | 71,165 | 29.77% | 49,760 | 20.81% | 678 | 0.28% | 46,300 | 19.37% | 239,068 |
| Wagoner | 9,053 | 42.05% | 7,041 | 32.70% | 5,381 | 24.99% | 54 | 0.25% | 2,012 | 9.35% | 21,529 |
| Washington | 11,342 | 47.93% | 6,593 | 27.86% | 5,664 | 23.94% | 64 | 0.27% | 4,749 | 20.07% | 23,663 |
| Washita | 1,912 | 35.81% | 1,929 | 36.13% | 1,468 | 27.50% | 30 | 0.56% | -17 | -0.32% | 5,339 |
| Woods | 2,225 | 46.58% | 1,361 | 28.49% | 1,167 | 24.43% | 24 | 0.50% | 864 | 18.09% | 4,777 |
| Woodward | 4,006 | 46.99% | 2,063 | 24.20% | 2,411 | 28.28% | 46 | 0.54% | 1,595[lower-alpha 2] | 18.71% | 8,526 |
| Totals | 592,929 | 42.65% | 473,066 | 34.02% | 319,878 | 23.01% | 4,486 | 0.32% | 119,863 | !8.62% | 1,390,359 |
Slates of Electors
Democrat: Earl E. Abernathy, Carl Albert, Obera Bergdall, Carolyn Crump, Lynn D. Hall, Glorine Henley, Grace Hudlin, Pete White
Republican: Jana Barker, Linda Blaylock, Ed Calhoon, Betty Casey, Allan Goodbary, Warren Roberts, Paul Thornbrugh, Dorothy Zumwalt,
Libertarian: Michael Alan Clem, Phillip R. Denney, Anne Hill Fruits, Randy Lee Gann, Vanessa C. McNeill, Brian J. Sullivan, David J. Walker, Paul O. Woodward
Independent: Pat Bigelow, Kathryn Fanning, Joe D. Sewell, A. D. Hollingsworth, A. R. Posey, John Sanders, Robert T. Jones, Jeanie Wolfgram[4]
Notes
- In this county where Perot ran ahead of Bush, margin given is Clinton vote minus Perot vote.
- In this county where Perot ran ahead of Clinton, margin given is Bush vote minus Perot vote.
References
- "1992 Presidential General Election Results – Oklahoma". Dave Leip’s U.S. Election Atlas. Retrieved June 8, 2012.
- "1992 Presidential General Election Data - National". Dave Leip’s U.S. Election Atlas. Retrieved June 8, 2012.
- Sullivan, Robert David; ‘How the Red and Blue Map Evolved Over the Past Century’; America Magazine in The National Catholic Review; June 29, 2016
- "Elections of 1992 - Results" (PDF). Oklahoma State Election Board.
.jpg.webp)
